Author

admin

Browsing

Coelacanth Energy Inc. (TSXV: CEI) (‘Coelacanth’ or the ‘Company’) is pleased to announce its financial and operating results for the three months and year ended December 31, 2024. All dollar figures are Canadian dollars unless otherwise noted.

2024 HIGHLIGHTS

  • Drilled and completed three Lower Montney wells and completed a previously drilled Upper Montney well on its 5-19 pad at Two Rivers East. Average test production from the three Lower Montney wells was 1,624 boe/d (61% light oil) and test production from the Upper Montney well was 1,338 boe/d (54% light oil). (2)
  • Secured revolving bank credit facilities for a total of $52.0 million from a Canadian chartered bank.
  • Substantially completed construction of pipelines to connect the 5-19 pad wells to the Two Rivers East facility.
  • Initiated construction of its Two Rivers East facility for a Q2 2025 on-stream date.
FINANCIAL RESULTS Three Months Ended Year Ended
  December 31 December 31
($000s, except per share amounts)  2024  2023  % Change  2024  2023  % Change  
             
Oil and natural gas sales 4,544 4,204 8 13,736 6,663 106
             
Cash flow from (used in) operating activities 3,157 (404 ) (881 ) 2,203 (4,234 ) (152 )
Per share – basic and diluted (1) 0.01 (-) (100 ) (0.01 ) (100 )
             
Adjusted funds flow (used) (1) 382 1,750 (78 ) 1,515 (333 ) (555 )
Per share – basic and diluted (-) (-)
             
Net loss (2,903 ) (750 ) 287 (8,897 ) (6,573 ) 35
Per share – basic and diluted (0.01 ) (-) 100 (0.02 ) (0.01 ) 100
             
Capital expenditures (1) 64,952 34,656 87 84,497 74,613 13
             
Adjusted working capital (deficiency) (1)       (18,637 ) 67,589 (128 )
             
Common shares outstanding (000s)            
Weighted average – basic and diluted 530,398 478,731 11 529,804 439,055 21
             
End of period – basic       530,670 528,650
End of period – fully diluted       615,930 609,989 1  


(1) See ‘Non-GAAP and Other Financial Measures’ section.
(2) See ‘Test Results and Initial Production Rates’ section.

  Three Months Ended Year Ended
OPERATING RESULTS (1) December 31 December 31
   2024  2023  % Change  2024  2023  % Change  
             
Daily production (2)            
Oil and condensate (bbls/d) 473 419 13 320 139 130
Other NGLs (bbls/d) 29 28 4 34 16 113  
Oil and NGLs (bbls/d) 502 447 12 354 155 128
Natural gas (mcf/d) 3,490 2,858 22 3,648 1,624 125  
Oil equivalent (boe/d) 1,084 923 17 962 426 126
             
Oil and natural gas sales            
Oil and condensate ($/bbl) 87.06 87.38 (-) 89.46 88.94 1
Other NGLs ($/bbl) 33.28 32.32 3 33.22 33.22  
Oil and NGLs ($/bbl) 83.97 83.88 83.99 83.28 1
Natural gas ($/mcf) 2.07 2.86 (28 ) 2.14 3.26 (34 )
Oil equivalent ($/boe) 45.57 49.47 (8 ) 39.01 42.82 (9 )
             
Royalties            
Oil and NGLs ($/bbl) 16.86 19.38 (13 ) 18.70 20.24 (8 )
Natural gas ($/mcf) 0.13 0.26 (50 ) 0.21 0.57 (63 )
Oil equivalent ($/boe) 8.22 10.20 (19 ) 7.66 9.57 (20 )
             
Operating expenses            
Oil and NGLs ($/bbl) 8.34 11.57 (28 ) 9.47 13.25 (29 )
Natural gas ($/mcf) 1.25 1.28 (2 ) 1.58 2.21 (29 )
Oil equivalent ($/boe) 7.88 9.57 (18 ) 9.47 13.25 (29 )
             
Net transportation expenses (3)            
Oil and NGLs ($/bbl) 5.54 4.95 12 3.46 4.10 (16 )
Natural gas ($/mcf) 0.76 0.81 (6 ) 0.73 1.12 (35 )
Oil equivalent ($/boe) 5.01 4.92 2 4.04 5.75 (30 )
             
Operating netback (loss) (3)            
Oil and NGLs ($/bbl) 53.23 47.98 11 52.36 45.69 15
Natural gas ($/mcf) (0.07 ) 0.51 (114 ) (0.38 ) (0.64 ) (41 )
Oil equivalent ($/boe) 24.46 24.78 (1 ) 17.84 14.25 25
             
Depletion and depreciation ($/boe) (10.76 ) (12.18 ) (12 ) (13.59 ) (14.93 ) (9 )
General and administrative expenses ($/boe) (15.46 ) (10.77 ) 44 (14.34 ) (27.08 ) (47 )
Share based compensation ($/boe) (7.08 ) (16.31 ) (57 ) (11.12 ) (23.49 ) (53 )
Loss on lease termination ($/boe) (2.02 ) 100 (0.57 ) 100
Finance expense ($/boe) (18.02 ) (1.28 ) 1,308 (6.33 ) (3.09 ) 105
Finance income ($/boe) 3.65 10.01 (64 ) 8.23 18.75 (56 )
Unutilized transportation ($/boe) (3.88 ) (3.08 ) 26 (5.37 ) (6.65 ) (19 )
Net loss ($/boe) (29.11 ) (8.83 ) 230 (25.25 ) (42.24 ) (40 )


(1) See ‘Oil and Gas Terms’ section.
(2) See ‘Product Types’ section.
(3) See ‘Non-GAAP and Other Financial Measures’ section.

Selected financial and operational information outlined in this news release should be read in conjunction with Coelacanth’s audited financial statements and related Management’s Discussion and Analysis (‘MD&A’) for the year ended December 31, 2024, which are available for review under the Company’s profile on SEDAR+ at www.sedarplus.ca.

OPERATIONS UPDATE

In Q4 2024, Coelacanth achieved two more significant milestones in its vision of moving the Two Rivers Montney Project from a large Montney land block to a proven resource with decades of inventory.

In 2022 and 2023, Coelacanth was able to prove productivity in the Lower Montney over a significant portion of lands at Two Rivers that allowed for the decision to build-out infrastructure and to continue pad drilling at Two Rivers East. During 2024, Coelacanth completed the licensing phase of the infrastructure and started construction while also continuing to develop the Montney resource.

In Q4 2024, Coelacanth was able to substantially complete all pipelines required for its 5-19 pad that connected it from the pad to the future facility and then on to a midstream gathering system. Concurrently, Coelacanth completed a successful Upper Montney well at Two Rivers East and changed the completion design in the Lower Montney on the 5-19 pad. The Upper Montney completion proved significant productivity (previously announced test rate of 1,136 boe/d) (1) in a zone that can be mapped over a significant portion of Coelacanth’s lands and should materially increase drilling inventory. The new Lower Montney completions yielded increased overall test rates as well as increasing the oil percentage (3-well average test rates previously announced at 1,624 boe/d with 61% light oil) (1) pointing to potentially higher per-well recoveries of oil and gas and corresponding per-well values than previously estimated.

Construction of the facility continued throughout Q1 2025 and is now substantially complete. With 9 wells and over 11,000 boe/d (1) of test production waiting on completion of the facility, we anticipate yet another major milestone will be reached imminently. We look forward to reporting updates on the Two Rivers East project as new developments arise.

(1) See ‘Test Results and Initial Production Rates’ section for more details.

OIL AND GAS TERMS

The Company uses the following frequently recurring oil and gas industry terms in the news release:

Liquids
Bbls Barrels
Bbls/d Barrels per day
NGLs Natural gas liquids (includes condensate, pentane, butane, propane, and ethane)
Condensat Pentane and heavier hydrocarbons
   
Natural Gas
Mcf Thousands of cubic feet
Mcf/d Thousands of cubic feet per day
MMcf/d Millions of cubic feet per day
MMbtu Million of British thermal units
MMbtu/d Million of British thermal units per day
   
Oil Equivalent
Boe Barrels of oil equivalent
Boe/d Barrels of oil equivalent per day


Disclosure provided herein in respect of a boe may be misleading, particularly if used in isolation. A boe conversion rate of six thousand cubic feet of natural gas to one barrel of oil equivalent has been used for the calculation of boe amounts in the news release. This boe conversion rate is based on an energy equivalency conversion method primarily applicable at the burner tip and does not represent a value equivalency at the wellhead.

NON-GAAP AND OTHER FINANCIAL MEASURES

This news release refers to certain measures that are not determined in accordance with IFRS (or ‘GAAP’). These non-GAAP and other financial measures do not have any standardized meaning prescribed under IFRS and therefore may not be comparable to similar measures presented by other entities. The non-GAAP and other financial measures should not be considered alternatives to, or more meaningful than, financial measures that are determined in accordance with IFRS as indicators of the Company’s performance. Management believes that the presentation of these non-GAAP and other financial measures provides useful information to shareholders and investors in understanding and evaluating the Company’s ongoing operating performance, and the measures provide increased transparency to better analyze the Company’s performance against prior periods on a comparable basis.

Non-GAAP Financial Measures

Adjusted funds flow (used)
Management uses adjusted funds flow (used) to analyze performance and considers it a key measure as it demonstrates the Company’s ability to generate the cash necessary to fund future capital investments and abandonment obligations and to repay debt, if any. Adjusted funds flow (used) is a non-GAAP financial measure and has been defined by the Company as cash flow from (used in) operating activities excluding the change in non-cash working capital related to operating activities, movements in restricted cash deposits and expenditures on decommissioning obligations. Management believes the timing of collection, payment or incurrence of these items involves a high degree of discretion and as such may not be useful for evaluating the Company’s cash flows. Adjusted funds flow (used) is reconciled from cash flow from (used) in operating activities as follows:

  Three Months Ended Year Ended
  December 31 December 31
($000s)  2024  2023  2024  2023
Cash flow from (used in) operating activities  3,157 (404 ) 2,203 (4,234 )
Add (deduct):        
Decommissioning expenditures 161 206 1,427 1,883
Change in restricted cash deposits (5,361 ) (2,376 ) (784 )
Change in non-cash working capital 2,425 1,948 261 2,802  
Adjusted funds flow (used) (non-GAAP) 382 1,750 1,515 (333 )


Net transportation expenses
Management considers net transportation expenses an important measure as it demonstrates the cost of utilized transportation related to the Company’s production. Net transportation expenses is calculated as transportation expenses less unutilized transportation and is calculated as follows:

  Three Months Ended Year Ended
  December 31 December 31
($000s)  2024  2023  2024  2023  
Transportation expenses 887 680 3,313 1,930
Unutilized transportation (387 ) (262 ) (1,891 ) (1,035 )
Net transportation expenses (non-GAAP) 500 418 1,422 895


Operating netback
Management considers operating netback an important measure as it demonstrates its profitability relative to current commodity prices. Operating netback is calculated as oil and natural gas sales less royalties, operating expenses, and net transportation expenses and is calculated as follows:

  Three Months Ended Year Ended
  December 31 December 31
($000s)  2024  2023  2024  2023
Oil and natural gas sales 4,544 4,204 13,736 6,663
Royalties (820 ) (866 ) (2,698 ) (1,489 )
Operating expenses (786 ) (813 ) (3,335 ) (2,062 )
Net transportation expenses (500 ) (418 ) (1,422 ) (895 )
Operating netback (non-GAAP) 2,438 2,107 6,281 2,217


Capital expenditures
Coelacanth utilizes capital expenditures as a measure of capital investment on property, plant, and equipment, exploration and evaluation assets and property acquisitions compared to its annual budgeted capital expenditures. Capital expenditures are calculated as follows:

  Three Months Ended Year Ended
  December 31 December 31
($000s)  2024  2023  2024  2023
Capital expenditures – property, plant, and equipment 233 4,584 1,206 26,928
Capital expenditures – exploration and evaluation assets 64,719 30,072 83,291 47,685
Capital expenditures (non-GAAP) 64,952 34,656 84,497 74,613


Capital Management Measures

Adjusted working capital (deficiency)
Management uses adjusted working capital (deficiency) as a measure to assess the Company’s financial position. Adjusted working capital is calculated as current assets and restricted cash deposits less current liabilities, excluding the current portion of decommissioning obligations.

($000s)  December 31, 2024  December 31, 2023
Current assets 11,579 87,616
Less:     
Current liabilities  (37,234 ) (28,754 )
Working capital (deficiency)  (25,655 ) 58,862
Add:     
Restricted cash deposits 4,900 6,784
Current portion of decommissioning obligations 2,118 1,943
Adjusted working capital (deficiency) (Capital management measure) (18,637 ) 67,589


Non-GAAP Financial Ratios

Adjusted Funds Flow (Used) per share
Adjusted funds flow (used) per share is a non-GAAP financial ratio, calculated using adjusted funds flow (used) and the same weighted average basic and diluted shares used in calculating net loss per share.

Net transportation expenses per boe
The Company utilizes net transportation expenses per boe to assess the per unit cost of utilized transportation related to the Company’s production. Net transportation expenses per boe is calculated as net transportation expenses divided by total production for the applicable period.

Operating netback per boe
The Company utilizes operating netback per boe to assess the operating performance of its petroleum and natural gas assets on a per unit of production basis. Operating netback per boe is calculated as operating netback divided by total production for the applicable period.

Supplementary Financial Measures

The supplementary financial measures used in this news release (primarily average sales price per product type and certain per boe and per share figures) are either a per unit disclosure of a corresponding GAAP measure, or a component of a corresponding GAAP measure, presented in the financial statements. Supplementary financial measures that are disclosed on a per unit basis are calculated by dividing the aggregate GAAP measure (or component thereof) by the applicable unit for the period. Supplementary financial measures that are disclosed on a component basis of a corresponding GAAP measure are a granular representation of a financial statement line item and are determined in accordance with GAAP.

PRODUCT TYPES

The Company uses the following references to sales volumes in the news release:

Natural gas refers to shale gas.
Oil and condensate refers to condensate and tight oil combined.
Other NGLs refers to butane, propane and ethane combined.
Oil and NGLs refers to tight oil and NGLs combined.
Oil equivalent refers to the total oil equivalent of shale gas, tight oil, and NGLs combined, using the conversion rate of six thousand cubic feet of shale gas to one barrel of oil equivalent as described above.

The following is a complete breakdown of sales volumes for applicable periods by specific product types of shale gas, tight oil, and NGLs:

  Three Months Ended Year Ended
  December 31 December 31
Sales Volumes by Product Type  2024  2023 2024  2023
         
Condensate (bbls/d) 22 12 32 7
Other NGLs (bbls/d) 29 28 35 16
NGLs (bbls/d) 51 40 67 23
         
Tight oil (bbls/d) 451 407 287 132
Condensate (bbls/d) 22 12 32 7
Oil and condensate (bbls/d) 473 419 319 139
Other NGLs (bbls/d) 29 28 35 16
Oil and NGLs (bbls/d) 502 447 354 155
         
Shale gas (mcf/d) 3,490 2,858 3,648 1,624
Natural gas (mcf/d) 3,490 2,858 3,648 1,624
         
Oil equivalent (boe/d) 1,084 923 962 426


TEST RESULTS AND INITIAL PRODUCTION RATES

The 5-19 Lower Montney well was production tested for 9.4 days and produced at an average rate of 377 bbl/d oil and 2,202 mcf/d gas (net of load fluid and energizing fluid) over that period which includes the initial cleanup where only load water was being recovered. At the end of the test, flowing wellhead pressure and production rates were stable.

The A5-19 Basal Montney well was production tested for 5.9 days and produced at an average rate of 117 bbl/d oil and 630 mcf/d gas (net of load fluid and energizing fluid) over that period which includes the initial cleanup where only load water was being recovered. At the end of the test, flowing wellhead pressure and production rates were stable.

The B5-19 Upper Montney well was production tested for 6.3 days and produced at an average rate of 92 bbl/d oil and 2,100 mcf/d gas (net of load fluid and energizing fluid) over that period which includes the initial cleanup where only load water was being recovered. At the end of the test, flowing wellhead pressure and production rates were stable.

The C5-19 Lower Montney well was production tested for 5.8 days and produced at an average rate of 736 bbl/d oil and 2,660 mcf/d gas (net of load fluid and energizing fluid) over that period which includes the initial cleanup where only load water was being recovered. At the end of the test, flowing wellhead pressure and production rates were stable.

The D5-19 Lower Montney well was production tested for 12.6 days and produced at an average rate of 170 bbl/d oil and 580 mcf/d gas (net of load fluid and energizing fluid) over that period which includes the initial cleanup where only load water was being recovered. At the end of the test, flowing wellhead pressure and production rates were stable.

The E5-19 Lower Montney well was production tested for 11.4 days and produced at an average rate of 312 bbl/d oil and 890 mcf/d gas (net of load fluid and energizing fluid) over that period which includes the initial cleanup where only load water was being recovered. At the end of the test, flowing wellhead pressure was stable, and production was starting to decline.

The F5-19 Lower Montney well was production tested for 4.9 days and produced at an average rate of 728 bbl/d oil and 1,607 mcf/d gas (net of load fluid and energizing fluid) over that period which includes the initial cleanup where only load water was being recovered. At the end of the test, flowing wellhead pressure and production rates were stable.

The G5-19 Lower Montney well was production tested for 7.1 days and produced at an average rate of 415 bbl/d oil and 1,489 mcf/d gas (net of load fluid and energizing fluid) over that period which includes the initial cleanup where only load water was being recovered. At the end of the test, flowing wellhead pressure and production rates were stable.

The H5-19 Lower Montney well was production tested for 8.1 days and produced at an average rate of 411 bbl/d oil and 1,166 mcf/d gas (net of load fluid and energizing fluid) over that period which includes the initial cleanup where only load water was being recovered. At the end of the test, flowing wellhead pressure was stable and production was starting to decline.

A pressure transient analysis or well-test interpretation has not been carried out on these nine wells and thus certain of the test results provided herein should be considered to be preliminary until such analysis or interpretation has been completed. Test results and initial production rates disclosed herein, particularly those short in duration, may not necessarily be indicative of long-term performance or of ultimate recovery.

Any references to peak rates, test rates, IP30, IP90, IP180 or initial production rates or declines are useful for confirming the presence of hydrocarbons, however, such rates and declines are not determinative of the rates at which such wells will continue production and decline thereafter and are not indicative of long-term performance or ultimate recovery. IP30 is defined as an average production rate over 30 consecutive days, IP90 is defined as an average production rate over 90 consecutive days and IP180 is defined as an average production rate over 180 consecutive days. Readers are cautioned not to place reliance on such rates in calculating aggregate production for the Company.

FORWARD-LOOKING INFORMATION

This document contains forward-looking statements and forward-looking information within the meaning of applicable securities laws. The use of any of the words ‘expect’, ‘anticipate’, ‘continue’, ‘estimate’, ‘may’, ‘will’, ‘should’, ‘believe’, ‘intends’, ‘forecast’, ‘plans’, ‘guidance’ and similar expressions are intended to identify forward-looking statements or information.

More particularly and without limitation, this news release contains forward-looking statements and information relating to the Company’s oil and condensate, other NGLs, and natural gas production, capital programs, and adjusted working capital (deficiency). The forward-looking statements and information are based on certain key expectations and assumptions made by the Company, including expectations and assumptions relating to prevailing commodity prices and exchange rates, applicable royalty rates and tax laws, future well production rates, the performance of existing wells, the success of drilling new wells, the availability of capital to undertake planned activities, and the availability and cost of labour and services.

Although the Company believes that the expectations reflected in such forward-looking statements and information are reasonable, it can give no assurance that such expectations will prove to be correct. Since forward-looking statements and information address future events and conditions, by their very nature they involve inherent risks and uncertainties. Actual results may differ materially from those currently anticipated due to a number of factors and risks. These include, but are not limited to, the risks associated with the oil and gas industry in general such as operational risks in development, exploration and production, delays or changes in plans with respect to exploration or development projects or capital expenditures, the uncertainty of estimates and projections relating to production rates, costs, and expenses, commodity price and exchange rate fluctuations, marketing and transportation, environmental risks, competition, the ability to access sufficient capital from internal and external sources and changes in tax, royalty, and environmental legislation. The forward-looking statements and information contained in this document are made as of the date hereof for the purpose of providing the readers with the Company’s expectations for the coming year. The forward-looking statements and information may not be appropriate for other purposes. The Company undertakes no obligation to update publicly or revise any forward-looking statements or information, whether as a result of new information, future events or otherwise, unless so required by applicable securities laws.

Coelacanth is an oil and natural gas company, actively engaged in the acquisition, development, exploration, and production of oil and natural gas reserves in northeastern British Columbia, Canada.

Further Information

For additional information, please contact:

Coelacanth Energy Inc.
Suite 2110, 530 – 8th Avenue SW
Calgary, Alberta T2P 3S8
Phone: (403) 705-4525
www.coelacanth.ca

Mr. Robert J. Zakresky
President and Chief Executive Officer

Mr. Nolan Chicoine
Vice President, Finance and Chief Financial Officer

Neither the TSX Venture Exchange nor its Regulation Services Provider (as that term is defined in the policies of the TSX Venture Exchange) accepts responsibility for the adequacy or accuracy of this release.

To view the source version of this press release, please visit https://www.newsfilecorp.com/release/249584

News Provided by Newsfile via QuoteMedia

This post appeared first on investingnews.com

Heliostar Metals Ltd. (TSXV: HSTR) (OTCQX: HSTXF) (FSE: RGG1) (‘Heliostar’ or the ‘Company’) is pleased to announce that it has appointed Mr. Stephen Soock as Vice President of Investor Relations and Development and Ms. Connie Lillico as Corporate Secretary.

Heliostar CEO, Charles Funk, commented, ‘We are delighted to add Stephen and Connie to our team as we continue to build our capacity. Stephen brings his understanding of institutional banking, sales and project knowledge from his role as an analyst at Stifel. He will lead the Company’s investor relationships and contribute to Heliostar’s strategy for production growth and reduction in our cost of capital. Connie brings a wealth of experience, having helped shepherd First Majestic from an ambitious junior to stable producer. She will lead the Company’s regulatory responsibilities in her role as Corporate Secretary. I would also like to thank Ms. Sheryl Dhillon for her diligent, professional long-term service to the Company as our Corporate Secretary.’

Mr. Soock has been in the mining industry for almost 20 years in both technical and capital markets roles. Prior to joining Heliostar, he was a Brendan Wood ranked sell side research analyst at Stifel. He covered growth and development companies in the precious metals space and brings a robust understanding of value creation from junior gold companies to his new role with Heliostar. Mr. Soock has also worked in various engineering roles at mine sites across Canada, including Vale’s Thompson Nickel operation, Mosaic’s Belle Plaine solution potash mine and Rio Tinto’s Diavik Diamond mine complex. He graduated from Queen’s University with a B.Sc. in Mining Engineering and is a CFA Charterholder.

Ms. Lillico brings 20 years of experience working with publicly traded companies in the mining industry. Ms. Lillico has worked with several TSX, TSX-V and NSYE listed companies and prior to joining Heliostar, Ms. Lillico served as the Corporate Secretary at First Majestic Silver Corp. Ms. Lillico has been involved in all aspects of administration of publicly listed companies including regulatory compliance, corporate governance, continuous disclosure requirements, equity financings, mergers and acquisitions, board and committee matters and shareholder communications.

Further, pursuant to the Company’s Omnibus Equity Incentive Compensation Plan, it has granted 700,000 stock options (‘Options’) at an exercise price of $1.05 and 150,000 restricted share units (each, an ‘RSU’) to employees and consultants of the Company. The Options are exercisable for a period of five years and will vest over the next two years. The RSUs will vest in three equal annual instalments commencing on the first anniversary of the grant date.

About Heliostar Metals Ltd.

Heliostar aims to grow to become a mid-tier gold producer. The Company is focused on increasing production and developing new resources at the La Colorada and San Agustin mines in Mexico, and on developing the 100% owned Ana Paula Project in Guerrero, Mexico.

FOR ADDITIONAL INFORMATION PLEASE CONTACT:

Charles Funk
President and Chief Executive Officer
Heliostar Metals Limited
Email: charles.funk@heliostarmetals.com
Phone: +1 844-753-0045
Rob Grey
Investor Relations Manager
Heliostar Metals Limited
Email: rob.grey@heliostarmetals.com
Phone: +1 844-753-0045


Neither TSX Venture Exchange nor its Regulation Services Provider (as that term is defined in the policies of the TSX Venture Exchange) accepts responsibility for the adequacy or accuracy of this release.

Cautionary Statement Regarding Forward-Looking Information

This news release includes certain ‘Forward-Looking Statements’ within the meaning of the United States Private Securities Litigation Reform Act of 1995 and ‘forward-looking information’ under applicable Canadian securities laws. When used in this news release, the words ‘anticipate’, ‘believe’, ‘estimate’, ‘expect’, ‘target’, ‘plan’, ‘forecast’, ‘may’, ‘would’, ‘could’, ‘schedule’ and similar words or expressions, identify forward-looking statements or information. These forward-looking statements or information relate to, among other things: the Company’s goal of becoming a mid-tier producer.

Forward-looking statements and forward-looking information relating to the terms and completion of the Facility, any future mineral production, liquidity, and future exploration plans are based on management’s reasonable assumptions, estimates, expectations, analyses and opinions, which are based on management’s experience and perception of trends, current conditions and expected developments, and other factors that management believes are relevant and reasonable in the circumstances, but which may prove to be incorrect. Assumptions have been made regarding, among other things, the receipt of necessary approvals, price of metals; no escalation in the severity of public health crises or ongoing military conflicts; costs of exploration and development; the estimated costs of development of exploration projects; and the Company’s ability to operate in a safe and effective manner and its ability to obtain financing on reasonable terms.

These statements reflect the Company’s respective current views with respect to future events and are necessarily based upon a number of other assumptions and estimates that, while considered reasonable by management, are inherently subject to significant business, economic, competitive, political, and social uncertainties and contingencies. Many factors, both known and unknown, could cause actual results, performance, or achievements to be materially different from the results, performance or achievements that are or may be expressed or implied by such forward-looking statements or forward-looking information and the Company has made assumptions and estimates based on or related to many of these factors. Such factors include, without limitation: precious metals price volatility; risks associated with the conduct of the Company’s mining activities in foreign jurisdictions; regulatory, consent or permitting delays; risks relating to reliance on the Company’s management team and outside contractors; risks regarding exploration and mining activities; the Company’s inability to obtain insurance to cover all risks, on a commercially reasonable basis or at all; currency fluctuations; risks regarding the failure to generate sufficient cash flow from operations; risks relating to project financing and equity issuances; risks and unknowns inherent in all mining projects, including the inaccuracy of reserves and resources, metallurgical recoveries and capital and operating costs of such projects; contests over title to properties, particularly title to undeveloped properties; laws and regulations governing the environment, health and safety; the ability of the communities in which the Company operates to manage and cope with the implications of public health crises; the economic and financial implications of public health crises, ongoing military conflicts and general economic factors to the Company; operating or technical difficulties in connection with mining or development activities; employee relations, labour unrest or unavailability; the Company’s interactions with surrounding communities; the Company’s ability to successfully integrate acquired assets; the speculative nature of exploration and development, including the risks of diminishing quantities or grades of reserves; stock market volatility; conflicts of interest among certain directors and officers; lack of liquidity for shareholders of the Company; litigation risk; and the factors identified under the caption ‘Risk Factors’ in the Company’s public disclosure documents. Readers are cautioned against attributing undue certainty to forward-looking statements or forward-looking information. Although the Company has attempted to identify important factors that could cause actual results to differ materially, there may be other factors that cause results not to be anticipated, estimated or intended. The Company does not intend, and does not assume any obligation, to update these forward-looking statements or forward-looking information to reflect changes in assumptions or changes in circumstances or any other events affecting such statements or information, other than as required by applicable law.

To view the source version of this press release, please visit https://www.newsfilecorp.com/release/249614

News Provided by Newsfile via QuoteMedia

This post appeared first on investingnews.com

Brunswick Exploration Inc. (TSX-V: BRW, OTCQB: BRWXF; ‘ BRW ‘ or the ‘ Company ‘) is pleased to report the first results from the 2025 Mirage winter drilling campaign where it drilled an additional twenty-four holes targeting extensions of known mineralized zones. The Mirage Project is located in the Eeyou Istchee-James Bay region of Quebec, approximately 40 kilometers south of the Trans-Taiga Road. This release focuses on the Central Zone including the MR-6, MR-3 dykes and Stacked Dyke area where BRW has continued to intersect wide and well mineralized intervals along strike and at depth.

Highlights include:

  • Significant interval of 36 meters at 1.51% Li2O in hole MR-24-102 within the Stacked Dyke area extending mineralization to the south-east and where an additional 13 dykes measuring between 1.3 and 9.35 meters were intercepted in the same hole.
  • New interval at the MR-6 Dyke with 1.32% Li2O over 28 meters in hole MR-24-101 extending the dyke to the northwest.
  • The MR-3, MR-6 and staked dyke system can now be traced together into a major swarm of spodumene bearing pegmatites covering a surface area of over 1,000 meters by up to 450m.
  • A total of 24 drill holes prioritizing near surfaces mineralization in the extension of the staked dyke area were completed during the winter. Assays are pending for a further 16 holes.

Mr. Killian Charles, President and CEO of BRW, commented: ‘To date, every drill campaign has demonstrated the significant exploration upside at Mirage and these first results from our winter 2025 campaign are no different. We have successfully extended the MR-6 pegmatite and continue to rapidly add considerable intercepts in the neighboring Stacked Dyke area. Interestingly, this high potential target area has continued to return multiple significant mineralized intercepts over the entirety of each drill hole and the Stacked Dyke area remains open in multiple directions.

Brunswick Exploration remains one of the most active lithium exploration companies globally and looks forward to releasing more drill results from Mirage and the restart of prospecting in Greenland. With its unique portfolio, the Company expects to have a milestone rich year.’

Mirage Project Drilling Overview

The Mirage Project comprises 427 claims located roughly 40 kilometers south of the Trans-Taiga Highway in Quebec’s James Bay region and 34 kilometers northeast of Winsome Resources’ Adina Project.

The 2025 winter drilling campaign focused on extending the mineralized Stacked Dyke area to the northeast. Highlights discussed in this release are shown in Table 1 and Figure 1. Collars are shown in Table 2.

Figure 1 : Central Zone of the Mirage Project

The holes MR-25-96 and MR-25-98 extended the MR-3 dyke 150m to the South with 0.79% Li2O over 12.2 meters from 55.8 meters to 68 meters and 1.26% Li2O over 7 meters from 176 meters to 183 meters. The hole MR-25-95 also confirmed the present of MR-3 and intersect a new dyke from 123.9 to 132 meters that returned 0.76% Li2O over 8.31 meters. This new shallow dipping mineralized pegmatite is located between MR-3 and MR-6 and is open in all directions. From 290 to 307 meters, the hole MR-25-95 holes also intersected three mineralized dykes that could be extensions to MR-6 at depth, dipping to the east.

The hole MR-25-102 extends the Staked Dyke area to the south with 14 mineralized dykes intercepted with the largest grading 1.51% Li2O over 35.65 meters from 166.6 meters to 202.25 meters. MR-23-32ext was drilled to connect the Stacked Dyke area to MR-6. Multiple dykes were intercepted in this hole and confirmed the presence of three new sub horizontal dykes under MR-6 with the largest returning 1.02% Li2O over 7.75 meters from 158.25 meters to 166 meters.

MR-25-101 confirmed the plunge to the north of MR-6 with an intercept of 28 meters at 1.32% Li2O from 173 meters to 201 meters and extends the MR-6 pegmatite by 100 meters. The hole MR-25-99 and MR-25-100 also intercepted the MR-6 dyke over 14.3 meters and 19.4 meters but showed signs of heavy alteration and no spodumene was identified.

Table 1 : 2025 Drilling Program Mentioned in this Release

Hole ID From (m) To (m) Length (m) Li2O (%)
MR-23-32-ext

143.55 145.55 2.00 2.26
147.55 150.00 2.45 1.41
158.25 166.00 7.75 1.02
MR-25-95

49.50 56.75 7.25 0.55
123.90 132.00 8.10 0.79
225.25 228.25 3.00 1.61
290.00 291.00 1.00 1.44
299.00 300.90 1.90 1.20
303.50 307.20 2.70 1.33
MR-25-96

55.80 68.00 12.20 0.79
147.60 150.90 3.30 0.90
160.55 163.20 2.65 0.27
MR-25-97 18.40 23.20 4.80 1.25
MR-25-98 176.00 183.00 7.00 1.26
MR-25-101 173.00 201.00 28.00 1.32
MR-25-102

17.25 21.00 3.75 1.33
65.70 69.00 3.30 2.66
96.15 105.50 9.35 0.75
117.50 119.50 2.00 1.34
132.75 134.65 1.90 1.81
138.90 140.30 1.40 0.88
157.60 159.85 2.25 1.10
166.60 202.25 35.65 1.51
212.20 214.85 2.65 1.24
239.70 243.60 3.90 1.33
247.95 250.75 2.80 1.74
254.70 256.50 1.80 1.68
292.15 296.10 3.95 1.52
299.00 305.10 6.10 1.19


Table 2
: 2025 Drilling Collars Mentioned in this Release

Hole ID Azimut Dip Length (m) UTM NAD83 z18 East UTM NAD83 z18 North
MR-23-32-ext 320 -73 162 683263 5941204
MR-25-95 30 -60 369 682821 5940489
MR-25-96 30 -90 207 682821 5940989
MR-25-97 320 -65 48 683503 5941233
MR-25-98 315 -60 301.45 682784 5940878
MR-25-99 320 -90 168 682912 5941336
MR-25-100 320 -90 201 682832 5941326
MR-25-101 320 -60 285 682912 5941336


QAQC

All drill core samples were collected under the supervision of BRW employees and contractors. The drill core was transported by helicopter and by truck from the drill platform to the core logging facility in Val-d’Or. Each core was then logged, photographed, tagged, and split by diamond saw before being sampled. All pegmatite intervals were sampled at approximately 1-meter intervals to ensure representativity. Samples were bagged; duplicated on reject, blanks and certified reference materials for lithium were inserted every 20 samples. Samples were bagged and groups of samples were placed in larger bags, sealed with numbered tags, in order to maintain a chain of custody. The sample bags were transported from the BRW contractor facility to the AGAT laboratory in Val-d’Or. All sample preparation and analytical work was performed by AGAT by sodium peroxide fusion with ICP-OES and ICP-MS finish. All results passed the QA/QC screening at the lab and all inserted standard and blanks returned results that were within acceptable limits. All reported drill intersections are calculated based on a lower cutoff grade of 0.3% Li2O, with maximum internal dilution of 5 meters. Host basalts adjacent to the dykes may grade up to 0.3% Li2O but were excluded from the reported intersections.

Qualified Person

The scientific and technical information contained in this press release has been reviewed and approved by Mr. Simon T. Hébert, VP Development. He is a Professional Geologist registered in Quebec and is a Qualified Person as defined by National Instrument 43-101.

About Brunswick Exploration

Brunswick Exploration is a Montreal-based mineral exploration company listed on the TSX-V under symbol BRW. The Company is focused on grassroots exploration for lithium in Canada, a critical metal necessary to global decarbonization and energy transition. The company is rapidly advancing the most extensive grassroots lithium property portfolio in Canada and Greenland.

Investor Relations/information

Mr. Killian Charles, President and CEO ( info@brwexplo.ca )

Cautionary Statement on Forward-Looking Information

This news release contains ‘forward-looking information’ within the meaning of applicable Canadian securities legislation based on expectations, estimates and projections as at the date of this news release. Forward-looking information involves risks, uncertainties and other factors that could cause actual events, results, performance, prospects and opportunities to differ materially from those expressed or implied by such forward-looking information. Factors that could cause actual results to differ materially from such forward-looking information include, but are not limited to, delays in obtaining or failures to obtain required governmental, environmental or other project approvals; uncertainties relating to the availability and costs of financing needed in the future; changes in equity markets; inflation; fluctuations in commodity prices; delays in the development of projects; the other risks involved in the mineral exploration and development industry; and those risks set out in the Corporation’s public documents filed on SEDAR at www.sedar.com. Although the Corporation believes that the assumptions and factors used in preparing the forward-looking information in this news release are reasonable, undue reliance should not be placed on such information, which only applies as of the date of this news release, and no assurance can be given that such events will occur in the disclosed time frames or at all. The Corporation disclaims any intention or obligation to update or revise any forward-looking information, whether as a result of new information, future events or otherwise, other than as required by law. Neither the TSX Venture Exchange nor its Regulation Services Provider (as that term is defined in the policies of the TSX Venture Exchange) accepts responsibility for the adequacy or accuracy of this news release.

A photo accompanying this announcement is available at https://www.globenewswire.com/NewsRoom/AttachmentNg/ea65ea8b-aa40-40d8-9be0-f901db569529

News Provided by GlobeNewswire via QuoteMedia

This post appeared first on investingnews.com

Golden State Warriors forward Jimmy Butler exited Game 2 against the Houston Rockets after landing hard on his backside and was ruled out of the contest.

Amen Thompson undercut Butler on a rebound attempt with 2:28 left in the first quarter as the Warriors trailed the Rockets 22-15 on Wednesday night in Houston. Butler landed hard on his tailbone and remained down on the court at Toyota Center as he writhed in pain. Thompson was called for a loose ball foul, his third of the first quarter.

Butler was able to get up gingerly and limped his way to the free throw line, where he made one of two before exiting the game with 1:51 remaining in the quarter. He skipped the bench and headed straight to the locker room.

Butler had three points (1-of-2 FG, 1-of-2 FT) in eight minutes of play before leaving the court. He was later ruled out with a pelvis contusion. The team said he will undergo an MRI Thursday.

‘Hopefully, he’s OK,’ Warriors coach Steve Kerr said. ‘We’ll see. … Jimmy always says he’s going to be fine. But we have to wait and see with the MRI.”

Houston went on to win, 109-94.

The Warriors got Butler in a trade with the Miami Heat at the deadline in February. Golden State hoped he would provide scoring and playmaking support for Stephen Curry, plus defensive help, in what could be its last, best run at another NBA title with this group.

Physicality has been a major storyline coming out of the first-round series between the Warriors and Rockets. Kerr was seen complaining about officiating to the referees during Wednesday’s broadcast.

‘Houston is a great defense and a very physical team, so that’s a big part of the equation of this series,’ Kerr said during the second quarter. ‘You have to handle it.’

In response to Butler’s exit, Kerr said ‘we will put Jonathan (Kuminga) in. We know he can play well against these guys and he’ll be able to attack the rim a little bit.’

The series now shifts to San Francisco, tied 1-1.

The USA TODAY app gets you to the heart of the news — fastDownload for award-winning coverage, crosswords, audio storytelling, the eNewspaper and more.

(This story has been updated with new information).

This post appeared first on USA TODAY

A federal judge said Wednesday that she cannot approve the proposed settlement of three athlete-compensation antitrust cases against the NCAA and Power Five conferences in its current form because of roster limits that were set to go into effect as part of the agreement.

U.S. District Judge Claudia Wilken wrote that she was inclined to approve the rest of the deal over a variety of other objections. That means she is otherwise prepared to accept an arrangement under which $2.8 billion in damages would be paid to current and former athletes — and their lawyers — over 10 years, and Division I schools would be able to start paying athletes directly for use of their name, image and likeness (NIL), subject to a per-school cap that would increase over time and be based on a percentage of certain athletics revenues.

However, during a final-approval hearing on April 7, she strongly suggested a system of phased-in implementation of the proposed sport-by-sport roster limits, which were to take effect on July 1 alongside an end to the NCAA’s existing system of sport-by-sport scholarship limits. A number of lawyers and scores of athletes and parents — some in emotional and personal written pleas — had asked Wilken to consider such a solution. And she gave the principals a week to consider that modification, as well as several other smaller ones.

The principals submitted a revised version of the deal that did not include changes to the roster limits, and now the NCAA and its schools and conferences are left with a potentially chaotic situation.

That concern was echoed by an athletic director who spoke to USA TODAY Sports and requested anonymity to protect because of the sensitivity of the situation. 

“It’s insanity,’ the person said. ‘She’s not supposed to be negotiating for the people who write letters.’

However, another athletic director also requesting anonymity due to the situation didn’t seem as concerned.

“It’s an easy fix,’ the person said. ‘Coaches wanted to grandfather all along. I’m just annoyed it means more days without this being settled and (having) rules to operationalize it set in place.’

Wilken wrote that within 14 days the parties “shall make their best efforts” to consult with a mediator “about potential modifications of the settlement agreement to address (her) concerns.” And she requested that three attorneys who represented clients objecting to the settlement because of the roster limits “consult remotely, together or separately” with the mediator and the lawyers for the principals.

In the meantime, she issued a case scheduling order that would begin to move the case toward a trial date that was left unspecified.

Steve Berman, the one of the lead attorneys for the athlete plaintiffs wrote in an email to USA TODAY Sports: “The good news is she overruled all the objections but one. As for the roster issue, armed with the leverage of this order, we are confident we can convince the NCAA and the conferences to fix the issue so that we satisfy Judge Wilken. If not, the Judge has re started the pre trial schedule in House and so be it if there is no fix.”

In a statement Wednesday night, the NCAA and the conferences said: “We are closely reviewing Judge Wilken’s order. Our focus continues to be on securing approval of this significant agreement, which aims to create more opportunities than ever before for student-athletes while fostering much-needed stability and fairness in college sports.”

Laura Reathaford, one of the three objectors’ lawyers referenced by Wilken, told USA TODAY Sports in a text message: “We are very happy with today’s order from Judge Wilken regarding the phasing-in of roster limits. The judge followed the law. We look forward to working with the parties on an amicable resolution to this problem.”

Under class-action antitrust law cited by Wilken, a settlement can be approved only if it “treats class members equitably relative to each other.”

She added that: “Because the settlement agreement is not fair and reasonable to the significant number of class members whose roster spots will be or have been taken away because of the immediate implementation of the settlement agreement, the Court cannot approve the settlement agreement in its current form.”

She wrote that one way of resolving this “could be to modify the settlement agreement to ensure that no (athletes) who have or had a roster spot will lose it as a result of the immediate implementation of the settlement agreement.”

Thousands of current walk-on athletes stand to lose their places on Division I teams had the settlement been approved under parameters, and schools have been making future roster plans for months. Some objectors have told Wilken in writing, as well as in-person at last week’s hearing, that they and other athletes already have been told by coaches that they will be losing their spots. Or, in the case of high school recruits, they have been told that spots they were going to receive will no longer exist.

However, in a filing April 14 that included a revised version of the settlement, the lawyers for the principals wrote they were not changing the proposed roster limits, in part because of concerns from the NCAA and the conferences about how to undo roster decisions that already had been put in motion.

‘The Parties appreciate the perspective and heartfelt stories that the student-athletes who objected shared, including those shared at the hearing. Defendants have evaluated — and discussed with numerous member institutions — the Court’s suggestion to ‘grandfather’ in the roster limits. Defendants, however, have informed (the plaintiffs’ lawyers) that those discussions revealed no practicable way to do so, because ‘grandfathering’ roster limits would cause significant disruption. The Parties are both independently aware that member institutions and student-athletes have been making decisions in anticipation of the roster limits being immediately effective if the Settlement is approved.’

Wilken showed no interest in this argument, saying that “is not a valid reason not a valid reason for approval of the agreement in its current form despite the harm” to athletes and recruits.

‘Any disruption that may occur is a problem of Defendants’ and NCAA members schools’ own making,” Wilken wrote. “The fact that the Court granted preliminary approval of the settlement agreement should not have been interpreted as an indication that it was certain that the Court would grant final approval.’

Citing a legal precedent from a case decided by the 9th U.S. Circuit Court of Appeals, which covers Wilken’s district, she added: “One of the factors that courts must consider when determining whether to grant final approval of a settlement agreement is ‘the reaction of the class members’ to the agreement. … One of the reasons for granting preliminary approval of a settlement agreement is to authorize the dissemination of notice to class members so that they have the opportunity to come forward with their reactions to the agreement.”

Wilken wrote that she is otherwise prepared to approve the settlement. She wrote that, with the exception of the “immediate implementation of the roster limits that will cause harm to certain” athletes, she “tentatively finds that (she) can grant final approval of the remainder of the settlement agreement as fair, reasonable, and adequate … notwithstanding” other objections to the settlement, which she said she “inclined to overrule.”

(New information was added to this story).

This post appeared first on USA TODAY
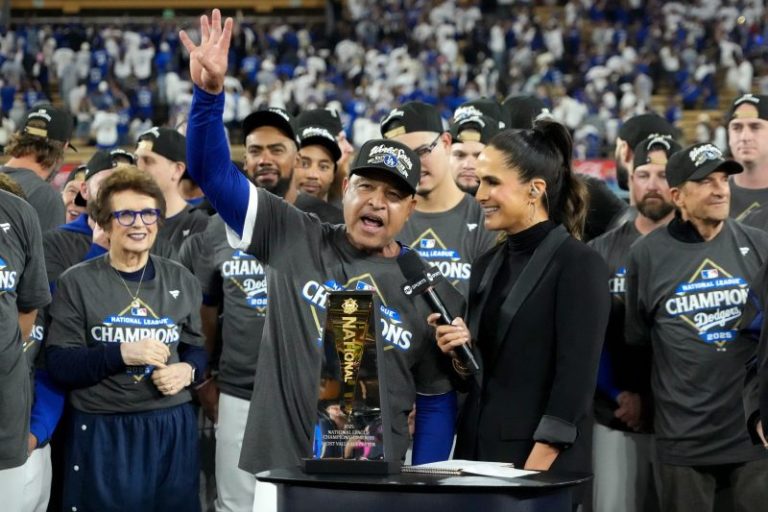
This week marks the four-year anniversary of what’s turned out to be a remarkable 2021 NFL draft.

The haul from the league’s 86th ‘Player Selection Meeting’ includes quite a few players who appear to be on the Hall of Fame fast track: Micah Parsons, Ja’Marr Chase, Penei Sewell, Patrick Surtain II, Amon-Ra St. Brown. And the likes of DeVonta Smith, Creed Humphrey, Landon Dickerson and Nico Collins are hardly slouches.

Yet that draft is, well, ‘remarkable’ for another reason. You’ll notice no quarterbacks are listed above even though they were touted as the backbone of the group at the time − and five were taken among the first 15 picks, including each of the first three. But fast forward to 2025, and the only member of that quintet who remains with the team that drafted him is the Jaguars’ Trevor Lawrence … and he hasn’t exactly been the generational passer he was forecast to be (even if he’s made a boatload of money while qualifying for one Pro Bowl). Meanwhile, Zach Wilson, Trey Lance, Justin Fields and Mac Jones all joined their third NFL teams earlier this offseason.

It’s a collection of players who pretty well encapsulate what’s basically the inherent boom-or-bust nature of the draft – and four years on, it becomes fair enough to begin affixing the dreaded bust label, especially as it pertains to when and where a player was drafted. And maybe, a la Sam Darnold or Baker Mayfield, some of the 2021 QBs can still rehabilitate their careers – but that doesn’t mean the damage isn’t done in their wake, whether or not it was truly a function of some personal shortcoming or simply a suboptimal situation.

Admittedly, the indictment of the 2021 draft’s heretofore failures may smack of recency bias, however some of its members have truly earned a spot on this list of the 50 hugest busts of the past 50 years.

Some words about the methodology: This ranking and analysis are certainly interspersed with opinion. But I tried not to view these wayward picks in a vacuum – taking into account what teams sacrificed to take a player, either in terms of trade currency or whom they opted not to select, when evaluating each bust. Some deals themselves are included since many prevented teams from choosing superior options. Naturally, extra weight was given to quarterback gaffes.

Lastly, I tried to have some fun and creativity in select spots to keep you engaged, so try not to get too bent out of shape if that guard or safety your team took in the top 10 before he petered out didn’t warrant a mention.

Here we go – and you’ll note I managed to shoehorn more than *50* players into this list:

1. QB Ryan Leaf, 2nd overall 1998, Chargers

It seems patently obvious who was superior more than a quarter-century after the fact, but he was very much in the conversation to be this draft’s No. 1 pick. Of course, the Colts wisely chose eventual five-time league MVP Peyton Manning. Meanwhile, the Bolts set themselves back years by taking Leaf (4-14 in 18 starts for the club with a 48.8 passer rating), whose gross immaturity and inability to solve pro defenses trumped his vast physical talent. What cements his infamy is the price San Diego paid to simply swap its initial No. 3 pick to get Arizona’s spot at No. 2 (more on that later). But the freight the Cardinals commanded, aside from the switch, was a second-rounder, an additional first-rounder in 1999 and two veterans (WR Eric Metcalf and LB Patrick Sapp). Oof.

2. OT Tony Mandarich, 2nd overall 1989, Packers

The Sports Illustrated cover boy deemed ‘The Incredible Bulk’ prior to the draft – he had uncommon athleticism and size for the position at the time – was labeled ‘The NFL’s Incredible Bust’ by SI only three years later. Mandarich’s steroid-fueled body and poor work ethic didn’t hold up against professional competition, and he later descended into drug and alcohol abuse. Any value he later provided at guard might have helped the Colts but obviously didn’t do the Pack any good. But this context truly frames his failure: Mandarich was the only player selected in the top five that year who didn’t wind up in the Pro Football Hall of Fame. Troy Aikman went No. 1, but Green Bay passed on Barry Sanders, Derrick Thomas and Deion Sanders.

3. QB JaMarcus Russell, 1st overall 2007, Raiders

It turned out to be a miserable year for passers, the likes of Brady Quinn, Kevin Kolb, John Beck and Drew Stanton also taken way too early. But Russell, who began his career with a lengthy holdout, never fulfilled the hype generated by his howitzer arm and legendary pro day. He lasted just three seasons, losing 18 of 25 starts and compiling an abysmal 65.2 passer rating, before laziness and weight gain washed him out of the league. Who could Oakland (at the time) have taken instead? Calvin Johnson, Joe Thomas, Adrian Peterson, Patrick Willis, Marshawn Lynch and Darrelle Revis all came off the board in the first half of Round 1.

4. QB Trey Lance, 3rd overall 2021, 49ers

San Francisco surrendered four picks, three of them first-rounders, to get into position for a guy who was basically a one-year starter at North Dakota State. In fairness to Lance, incumbent QB Jimmy Garoppolo, subsequent injuries and a shoddy development plan that HC Kyle Shanahan largely blamed himself for derailed Lance before he had a legitimate chance to prove himself in Silicon Valley. But the Niners saw enough to pull the plug after two years, opting to give the reins to 2022 seventh-rounder Brock Purdy and sending Lance to Dallas for a Round 4 pick. (He signed with the Chargers earlier this month.) But just imagine if the 49ers had taken Chase, Sewell, Surtain or Parsons instead of Lance … who maybe eventually blossoms elsewhere, little good as that will do San Fran.

4a. QB Zach Wilson, 2nd overall 2021, Jets

Now queue up the unfortunate 2021 QB corollaries – and brace yourself, Jets fans, as this is merely the first of many mentions. The NYJ effectively threw in the towel on Wilson in 2023 after trading for four-time league MVP Aaron Rodgers … then were quickly forced to turn back to the BYU product, who again miserably failed in his third attempt to produce at a level commensurate with his draft billing. Traded to the Denver Broncos during last year’s draft, Wilson is now with the Miami Dolphins – his NFL completion rate (57%) and passer rating (73.2) presently married to 23 TD passes and 34 turnovers. The mistake is magnified by the fact the Jets could have augmented the roster in 2021 around Darnold with Chase, Sewell, Surtain or Parsons, among others, all available.

4b. QB Mac Jones, 15th overall 2021, Patriots

With the help of former New England OC Josh McDaniels, he looked like a legitimate NFL starter … for a year, anyway. Then it all fell apart for Jones, also largely undermined by an organization that didn’t give him sufficient positional coaching or playmakers. It got so bad in 2023, the decision was made to send Jones home in a trade with Jacksonville, where he backed up Lawrence in 2024. Now, like Darnold, Jones is hoping to initiate something of a career reboot while apprenticing with Shanahan and the 49ers.

4c. QB Justin Fields, 11th overall 2021, Bears

Recently signed by the Jets after a perplexing year in Pittsburgh, maybe a guy with titillating dual-threat abilities resurrects his career in New York. But not before the Bears sent four draft selections (including two first-rounders) to the Giants to get Fields four years ago … then almost completely failed to put a legitimate supporting cast around him for two seasons. Many of Fields’ frequent failures must be laid at the doorstep of Halas Hall, a building that’s been so dysfunctional in recent years that the Bears were in position to replace him just three years later – 2024 No. 1 pick Caleb Williams now charged with trying to overcome his surroundings.

5. QB Jeff George, 1st overall 1990, Colts

He looked like Uncle Rico, threw like him, too … and basically played like the “Napoleon Dynamite” folk hero. Navigating into the top spot for George forced Indianapolis to surrender Pro Bowl OT Chris Hinton, future Pro Bowl WR Andre Rison and a first-round pick in 1991 to Atlanta – where George wound up himself in 1994 after wearing out his welcome with a bad attitude and 14-35 record for the Colts, who passed on three eventual Hall of Famers in the first round (more on them later). Never particularly popular in the locker room, George played for five different teams – and did post better numbers, if not many more wins, later in his career.

6. RB Lawrence Phillips, 6th overall 1996, Rams

Bad player. Bad dude. And St. Louis should have known better. The Rams parted with DT Sean Gilbert to acquire the Phillips pick – Eddie George was still available – and they exported Jerome Bettis to Pittsburgh in a separate deal to clear the way for Nebraska’s fallen star. Phillips averaged 3.4 yards per carry and didn’t make it through his second season with the Rams, cut amid excessive in-season drinking.

7. Jets’ decisions to trade down in 1997

After going 1-15 in 1996, Gang Green most definitely earned the No. 1 pick of the ’97 draft – which they surely would have used for Manning … had he opted not to return to the University of Tennessee for his senior year. (And you can argue that newly acquired coach Bill Parcells could have done more to entice Manning to go pro, but that’s neither here nor there.) However after Manning was off the table, Parcells dealt down from No. 1 to No. 6 in a bid to restock this roster, passing on the opportunity to snatch future Hall of Fame LT Orlando Pace. Then Parcells dropped from No. 6 to No. 8, passing on the opportunity to get future Hall of Fame LT Walter Jones. (Ugh and ugh.) LB James Farrior, who was much better in Pittsburgh later in his career than during his Gotham stint, ‘headlined’ New York’s forgettable haul, which could have also included Hall of Fame TE Tony Gonzalez, who went 13th.

8. Colts’ decision to draft John Elway No. 1 in 1983

His talent obviously justified the selection, but team brass should have taken Elway seriously when he threatened to play baseball rather than for Baltimore. In the end, he launched his Hall of Fame career in Denver while the Colts were left with Hinton, backup QB Mark Herrmann, a first-round pick in 1984 (spent on G Ron Solt) and, in a year’s time, a one-way, franchise-wide ticket to Indianapolis.

9. QB Robert Griffin III, 2nd overall 2012, Washington

The team shipped three first-round picks and one in Round 2 to the Rams for the chance to take RG3. Initially, it seemed a reasonable gambit as the 2011 Heisman Trophy winner won Offensive Rookie of the Year honors while leading a charge to the NFC East title. The rest is unfortunate history, both for Griffin personally and the organization at large. But Washington may finally be picking up the pieces now that Jayden Daniels has arrived as the latest presumed savior.

9a. Rams’ haul for Robert Griffin III

On the opposite end of the RG3 coin? St. Louis parlayed its bounty into Michael Brockers, Janoris Jenkins, Isaiah Pead, Rokevious Watkins, Alec Ogletree, Stedman Bailey, Zac Stacy and Greg Robinson. Some decent (and not-so-decent) players there, but obviously not a group that came anywhere close to salvaging the NFL in The Gateway City, much less providing the bedrock for a perennial powerhouse.

9b. DE Chase Young, 2nd overall 2020, Washington

Basically the defensive version of RG3 – a rookie of the year before suffering a serious knee injury and ultimately falling out of favor with the organization. A player who entered the league with astronomical expectations – reference the frequent (and unfair) Lawrence Taylor comparisons – Young had 7½ sacks in 2020 … and 6½ total over his next three seasons with Washington before being unceremoniously traded for a third-rounder in 2023. Justin Jefferson, Justin Herbert, CeeDee Lamb and Tristan Wirfs were among the players taken later in Round 1 of Young’s draft.

10. OLB Aundray Bruce, 1st overall 1988, Falcons

Atlanta also thought it was getting the next Taylor. Nope. Bruce was no better than a sub package guy, including spot duty at tight end. There were five Hall of Famers picked elsewhere in Bruce’s draft and a dominant pass rusher (Neil Smith) directly after him.

11. RB Bo Jackson, 1st overall 1986, Buccaneers

Don’t get it twisted – this isn’t a dig at a guy who might truly be a ‘once-in-a-lifetime’ athlete. Instead, interpret it as a dig at a long-feckless franchise that chose to squander its pick even though Jackson had vowed never to play in Tampa, believing the team deliberately cost him his baseball eligibility at Auburn while trying to strong-arm him into a football-only career. The Bucs took Jackson anyway, and he was soon stroking towering taters for the Kansas City Royals … before joining the Raiders in 1987.

12. OT Robert Gallery, 2nd overall 2004, Raiders

He never approached his pre-draft buildup and, like Mandarich years before, only became serviceable after moving to guard. Who could Oakland have had instead? Larry Fitzgerald, Philip Rivers, Sean Taylor and Ben Roethlisberger heard their names called shortly after Gallery’s selection.

13. RB Blair Thomas, 2nd overall 1990, Jets

To think future Hall of Famers Cortez Kennedy and Junior Seau were sitting there. Or, if New York really had to have a tailback, eventual all-time leading rusher Emmitt Smith was around until No. 17. He only wound up outrushing Thomas by 16,000 yards.

14. Bills’ decision to draft Tom Cousineau No. 1 in 1979

Buffalo owned the choice after dealing O.J. Simpson to the 49ers. But Cousineau took the Canadian Football League’s money and bolted, never playing a down for the Bills. Hall of Famers Dan Hampton and Kellen Winslow went later in that first round.

15. Seahawks’ decision to trade down in 1977

They were induced to deal out of No. 2 after Tony Dorsett threatened not to play in Seattle, so the Cowboys moved up for the future Hall of Fame back. The Seahawks were left with Steve August, Tom Lynch, Terry Beeson and Glenn Carano. Who? Exactly. Guess who won the Super Bowl the following season …

16. QB Art Schlichter, 4th overall 1982, Colts

On the field, he was horrendous (42.6 passer rating). Off the field, he was worse, his gambling problems leading to his suspension for the 1983 season and, later, prison. Schlichter’s issues also forced Baltimore into its ill-advised Elway pick the next year.

17. QB Jack Thompson, 3rd overall 1979, Bengals

The ‘Throwin’ Samoan’ never threw very effectively in six NFL seasons. Furthermore, Cincinnati was just fine behind center anyway with Ken Anderson, who would lead the Bengals to their first Super Bowl two years later. Also, Phil Simms was chosen four slots after Thompson – or, if Cincy needed, like, a developmental quarterback, they could have had, uh, Joe Montana in Round 3 …

18. DE Dion Jordan, 3rd overall 2013, Dolphins

The slender pass rusher was repeatedly suspended and only rewarded Miami with three sacks in two seasons. The Dolphins paid a first- and second-round pick to Oakland to get the Oregon prospect. Philadelphia took future All-Pro OT Lane Johnson with the next selection.

19. WR Johnny ‘Lam’ Jones, 2nd overall 1980, Jets

New York hoped his Olympic speed would translate into stardom. Not so much. Jones never looked natural as a receiver, often leaving his feet while trying to catch easy passes. The next player taken was Hall of Famer Anthony Munoz, arguably the best left tackle of all time. The next receiver selected was Hall of Famer Art Monk. Yeah.

20. DT Steve Niehaus, 2nd overall 1976, Seahawks

Seattle’s maiden draft selection didn’t turn out nearly as well as fellow expansion franchise Tampa Bay’s after the Bucs landed future Hall of Famer Lee Roy Selmon at No. 1. (The Seahawks recovered by acquiring HOFer Steve Largent, who was taken by the Oilers in Round 4 that year.)

21. Buccaneers’ decision to trade down in 1978

Confident in RB Ricky Bell, the No. 1 pick in 1977, Tampa Bay sent the top pick of ’78 to Houston for TE Jimmie Giles and four selections, including a first- and second-rounder. The Oilers? Hello, Earl Campbell.

22. QB Josh Rosen, 10th overall 2018, Cardinals

Arizona traded a first-, third- and fifth-round pick to move up five spots to snatch him 10th overall in 2018. He flopped as a rookie and was replaced by Kyler Murray atop the 2019 draft … when Rosen also burned the Dolphins, who gave up a Round 2 pick to rescue him from the desert before he failed in Miami. Like Darnold, Rosen was a victim of circumstances, but the Cards wouldn’t have reset had they picked Lamar Jackson in 2018 instead.

23. CB Jeff Okudah, 3rd overall 2020, Lions

No corner has ever been picked higher. But heading into his sixth season – when many first-rounders are already raking in money from lucrative second contracts – Okudah is resetting with his fourth team (Minnesota). He’s missed 40 games in his career to date. Worse, quarterbacks have a 103.8 passer rating when targeting the former Ohio State star. Oh, and just to repeat, Justin Jefferson, Justin Herbert, CeeDee Lamb and Tristan Wirfs were among the players taken later in Round 1 that year.

24. P Russell Erxleben, 11th overall 1979, Saints

Groan. Known for his record 67-yard field goal in college with Texas, he proved neither the kicker nor punter New Orleans envisioned. Erxleben is the highest-drafted special teamer of the common draft era (since 1967), going two spots ahead of Hall of Famer Winslow. Erxleben landed in prison later in life for securities fraud.

24a. K Steve Little, 15th overall 1978, Cardinals

Taking a kicker in Round 1, especially in an era when the position was far less reliable, could be forgiven. But not if your guy misses 14 of 27 field goal attempts in three seasons … and when you could’ve had Ozzie Newsome or Doug Williams.

25. QB Sam Darnold, 3rd overall 2018, Jets

In the former USC star’s robust defense, New York did next to nothing to help him flourish, Darnold’s development further hampered by foot and shoulder injuries, mono and checked-out HC Adam Gase. But given then-GM Mike Maccagnan surrendered the No. 6 overall pick (used by the Colts on future All-Pro G Quenton Nelson) and three high second-rounders to advance three slots in order to get into position for Darnold – and he seemed like a slam-dunk acquisition at the time – it’s hard to view this gamble as anything other than a failure given his inability to overcome his circumstances … especially as QBs drafted later (2019 and 2023 MVP Lamar Jackson, 2024 MVP Josh Allen) figured out how to thrive. Yet Darnold finally did, too, last year, when he blossomed into a Pro Bowler with the Minnesota Vikings … success he hopes to sustain in Seattle now.

26. OLB Vernon Gholston, 6th overall 2008, Jets

He played 45 games for New York. He registered nary a sack.

27. QB Kelly Stouffer, 6th overall 1987, Cardinals

He held out his rookie season and got traded to Seattle. Lucky for the Cards, given Stouffer (7 TD passes, 19 interceptions in five seasons) would make subsequent Seahawks franchise QB Rick Mirer – continue reading – look like an All-Pro.

28. WR Troy Williamson, 7th overall 2005, Vikings

Minnesota basically traded Randy Moss to Oakland in order to get this guy … who finished with 153 fewer TDs than Moss.

29. TE Kyle Brady, 9th overall 1995, Jets

New York could have had Warren Sapp. Or Ty Law. Or Derrick Brooks. But in typical J-E-T-S fashion, they screwed it up royally. (And the availability of Law and Brooks didn’t deter the Jets from taking DE Hugh Douglas 16th overall, either.)

30. QB Sam Bradford, 1st overall 2010, Rams

He certainly wasn’t a bad player, and many forget he was Offensive Rookie of the Year. But his injury history at Oklahoma was predictive. The six players selected after Bradford? Ndamukong Suh, Gerald McCoy, Trent Williams, Eric Berry, Russell Okung and Joe Haden, with Earl Thomas off the board at No. 14. Bradford later cost Minnesota a first- and fourth-rounder in 2016 to replace Teddy Bridgewater but didn’t get the Vikings to the postseason and lost his job to Case Keenum the next year. Bradford never appeared in a playoff game.

31. Browns’ haul for Julio Jones

Cleveland dealt the sixth pick in 2011 to Atlanta – Falcons GM Thomas Dimitroff was widely panned for paying so much to get Jones – and ultimately wound up with NT Phil Taylor, WR Greg Little, FB Owen Marecic and QB Brandon Weeden. (Good job, Tom.)

32. Browns’ 2012 draft

As bad as Weeden (22nd overall) was, RB Trent Richardson, the No. 3 pick, was worse based on relative value. Cleveland sent Minnesota four picks to swap from fourth to third overall. Even when the Browns flipped Richardson to the Colts for a first-round pick in 2013, they eventually wound up with Johnny Manziel.

32a. Browns’ 2014 draft

Manziel (22nd overall) was dreadful. CB Justin Gilbert, the No. 8 pick, was a bigger blunder given his slot.

33. QB Brady Quinn, 22nd overall 2007, Browns

Not only did he add to Cleveland’s litany of quarterback washouts, he cost the Browns a first- and second-round pick in order to trade up for him. (In case you hadn’t noticed, it’s a QB death knell to get drafted by Cleveland at No. 22.)

34. QB Akili Smith, 3rd overall 1999, Bengals

Just abject in four seasons (3-14 record, 5 TD passes, 13 INTs). The next four players taken were Edgerrin James, Ricky Williams, Torry Holt and Champ Bailey. No. 12 selection Cade McNown, Chicago’s QB failure that year, looked all-world relative to Smith.

35. WR Charles Rogers, 2nd overall 2003, Lions

Sadly, he couldn’t evade drugs or injuries. Also, future Hall of Famer Andre Johnson went to the Texans with the next pick.

36. QB Heath Shuler, 3rd overall 1994, Washington

He was a better congressman than quarterback – and wasn’t even the best passer Washington picked in 1994, seventh-rounder Gus Frerotte proving far superior.

37. DE Andre Wadsworth, 3rd overall 1998, Cardinals

Often forgotten in the aftermath of the Manning-Leaf debate atop that year’s draft, but some scouts considered Wadsworth a better prospect than both quarterbacks. Knee injuries sapped his vast potential after just three seasons. Hall of Famer Charles Woodson was chosen next.

38. QB Rick Mirer, 2nd overall 1993, Seahawks

That year’s Drew Bledsoe consolation prize, Mirer was wretched in four years with Seattle (20-31 record, 65.2 passer rating). Oh, and Hall of Famers Willie Roaf and Bettis were available in the top 10.

38a. Bears’ 1997 trade for QB Rick Mirer

Forgot about this, didn’t you? Seattle stole Chicago’s first-round pick in exchange for Mirer, who was even worse in one season in the Windy City. Meanwhile, the Seahawks recovered to draft stud CB Shawn Springs.

39. QB Mitchell Trubisky, 2nd overall 2017, Bears

Another botched move by Chicago atop a draft in an ill-considered bid to fix the century-old organization’s ongoing quarterback conundrum. To simply swap the No. 2 and No. 3 overall selections, the Bears had to give the 49ers a third- and fourth-rounder plus a future third-rounder (used on eventual All-Pro LB Fred Warner in 2018). GM Ryan Pace then picked Trubisky, who was middling at best while starting for two Bears playoff teams – the 2018 edition was Super Bowl-caliber otherwise – when he could have had Patrick Mahomes or Deshaun Watson.

39a. DL Solomon Thomas, 3rd overall 2017, 49ers

For all the capital the Niners inhaled in the Trubisky deal, they flubbed much of it by taking the disappointing Stanford star before trading the 2017 third-round pick … which the Saints used on perennial Pro Bowl RB Alvin Kamara.

40. Raiders’ 2020 draft

As much trouble as former GM Mike Mayock ran into in early rounds, this was the class that ultimately might have gotten him fired. First-rounders Henry Ruggs and Damon Arnette (the latter obtained as part of the Khalil Mack trade years before) were both released in 2021 amid serious off-field incidents, an inebriated Ruggs involved in an auto accident that killed a woman and her dog. Third-rounder Lynn Bowden Jr. was traded to Miami before his rookie season and never amounted to much in the NFL. Fellow third-rounder Tanner Muse never played for the Raiders, either, while WR Bryan Edwards lasted just two seasons in Las Vegas. The best of the bunch is Round 4 G John Simpson, who blossomed with the Ravens and Jets.

40a. Raiders’ 2019 draft

With three first-rounders, this was supposed to be the year that Mayock set the Silver and Black up for years of success. But the immediate criticism of DE Clelin Ferrell, taken fourth overall, proved justified. S Johnathan Abram didn’t make it through his fourth season with the franchise. RB Josh Jacobs was a productive player, but not one the team deemed worthy of a multi-year contract extension. Round 2 CB Trayvon Mullen was also an ex-Raider after three seasons. (Qualifying note: Mayock found DE Maxx Crosby and WR Hunter Renfrow on Day 3, not that they were able to save his job in the final analysis.)

40b. OL Alex Leatherwood, 17th overall 2021, Raiders

Mayock did get one more crack at the draft … and took the Alabama lineman much earlier than most observers had him projected. Unable to handle right tackle in the NFL, Leatherwood moved to guard but was waived prior to the 2022 season – by the regime that succeeded Mayock.

41. Raiders’ 2011 trade for QB Carson Palmer

Can’t blame this on Mayock. Oakland gave up a first- and second-rounder to pry the former No. 1 pick out of Cincinnati and quasi-retirement. A three-time Pro Bowler, Palmer was 8-16 in 1½ seasons with the Silver and Black and was shipped to Arizona – where he reverted to star form – for the net gain of a Round 6 choice in 2013.

42. DE Mike Mamula, 7th overall 1995, Eagles

It’s bad enough that Philly got duped into taking the original scouting combine superstar. Adding to the ignominy, the Eagles traded the 12th pick to Tampa Bay (the Bucs used it on Warren Sapp) plus two second-rounders to elevate into this mistake.

43. Colts’ 1992 draft

Indianapolis owned the top two picks and selected DE Steve Emtman and LB Quentin Coryatt. Emtman was beset by injuries, and Coryatt was a pedestrian performer. This would rank higher, but the ’92 draft was short on talent and hasn’t produced one Hall of Famer – despite running 12 rounds – though Dallas’ Darren Woodson might eventually reach Canton.

44. RB Ki-Jana Carter, 1st overall 1995, Bengals

In fairness, he ripped up his knee in his first preseason game and was never the same. Of note, it could have been much worse for Cincinnati. Expansion Carolina only charged the Bengals the fifth and 36th overall picks to move up for Carter, sweetheart terms by today’s standards. Yet it worked out OK for the Panthers, who took QB Kerry Collins.

44a. DT Dan ‘Big Daddy’ Wilkinson, 1st overall 1994, Bengals

He was average at best for Cincinnati, which could have avoided the Carter gaffe in 1995 by taking Marshall Faulk No. 1 in 1994.

45. WR Treylon Burks, 18th overall 2022, Titans

Rather than pay WR A.J. Brown – now a perennial Pro Bowler, legitimate 1,500-yard receiver and Super Bowl champion – Tennessee traded him to Philadelphia for a pair of picks, including this first-rounder used on Burks. The Arkansas product has produced just 53 catches for 699 yards and one TD in three seasons – a period when the Titans felt the need to acquire WRs DeAndre Hopkins and Calvin Ridley, the latter getting a huge contract last year.

45a. WR Jalen Reagor, 21st overall 2020, Eagles

It must also be noted that Philadelphia was compelled to trade for Brown on the first night of the 2022 draft after the disastrous selection of Reagor, who was Burks-esque through two seasons with 64 receptions for 695 yards and three TDs before being shipped to Minnesota for a cheesesteak. However the real cardinal sin associated with Reagor was that the Vikings drafted Jefferson with the next selection.

46. Todd Blackledge, Tony Eason, Ken O’Brien

If you drafted a quarterback in the first round of the 1983 draft, you had a 50% shot at getting a Hall of Famer – Elway, Jim Kelly or Dan Marino. Otherwise, you got one of these guys, all taken with Marino (27th overall) still available.

46a. DT Gabe Rivera, 21st overall 1983, Steelers

For whatever reason, Pittsburgh also bypassed hometown hero Marino, who would have made a mighty fine acquisition with Terry Bradshaw heading into his final season. Driving drunk, Rivera was paralyzed in a car accident midway through his rookie season.

47. Bears’ post-Walter Payton first-round RBs

Brad Muster (23rd overall pick, 1994), Rashaan Salaam (21st in 1995), Curtis Enis (5th in 1998) and Cedric Benson (4th in 2005) all bombed in the years following Sweetness’ retirement after the 1987 campaign.

48. Cowboys’ 2000 trade for WR Joey Galloway

In one of owner Jerry Jones’ most notorious moves, Dallas sent two first-rounders to Seattle for the speedy receiver. Galloway averaged fewer than 50 yards per game in four years in Big D, while the Seahawks snagged future MVP Shaun Alexander.

49. QB J.P. Losman, 22nd overall 2004, Bills

He followed Eli Manning, Rivers and Roethlisberger as the fourth Round 1 passer in 2004. Oops. Oh yeah, Buffalo also gave up a first-, second- and fifth-rounder to get Losman when it could have simply waited to grab future Pro Bowler Matt Schaub in Round 3.

50. QB Blaine Gabbert, 10th overall 2011, Jaguars

Aside from quarterbacks not named Cam Newton, this was an epic draft. Jacksonville didn’t get a crack at Newton, Von Miller, A.J. Green, Patrick Peterson, Julio Jones or Tyron Smith but could’ve taken J.J. Watt, Robert Quinn, Mike Pouncey, Ryan Kerrigan, Cam Jordan or Mark Ingram (among others – even Andy Dalton) instead of Gabbert. The Jags also gave up a second-rounder to move up six spots for Gabbert. Oy.

50a. QB Jake Locker, 8th overall 2011, Titans

Aside from quarterbacks not named Cam Newton, this was an epic draft. Tennessee didn’t get a crack at Newton, Von Miller, A.J. Green, Patrick Peterson or Julio Jones but could’ve taken Tyron Smith, J.J. Watt, Robert Quinn, Mike Pouncey, Ryan Kerrigan, Cam Jordan or Mark Ingram (among others – even Andy Dalton) instead of Locker. Oy.

50b. QB Christian Ponder, 12th overall 2011, Vikings

Aside from quarterbacks not named Cam Newton, this was an epic draft. Minnesota didn’t get a crack at Newton, Von Miller, A.J. Green, Patrick Peterson, Julio Jones, Tyron Smith or J.J. Watt but could’ve taken Robert Quinn, Mike Pouncey, Ryan Kerrigan, Cam Jordan or Mark Ingram (among others – even Andy Dalton) instead of Ponder. Oy.

All NFL news on and off the field. Sign up for USA TODAY’s 4th and Monday newsletter.

This post appeared first on USA TODAY

BOULDER, Colo. — Deion Sanders wasn’t so much Coach Prime as he reflected on the upcoming NFL draft and the immense attention flowing with one particular prospect.

He was Daddy Prime.

And boy, daddy certainly has a vast collection of fresh receipts.

Shedeur Sanders, Deion’s youngest son, is undoubtedly the most polarizing player in the draft. The Colorado quarterback was once considered as a possibility to be chosen No. 1 overall when the draft kicks off on Thursday night at Lambeau Field in Green Bay. Now, if so many of the draft pundits are to be believed, Shedeur’s standing in recent weeks has supposedly tumbled like Tesla stock.

At least that’s the narrative fueling draft hype. Shedeur’s talent, mechanics, arm strength and character have all been criticized during the ramp-up to the draft, often but not always by nameless, faceless sources.

Sure, Shedeur tended to hold onto the ball too long behind shaky protection. Yet his production, toughness and resilience can’t be knocked.

In some extreme cases, though, the shots have been brutal. Of course, even the connection to his college coach – and Hall of Fame father – has been cast in some cases as a detriment.

“It’s silly to us,” Deion told USA TODAY Sports during an expansive interview. “Most of it is laughable. What I told him, too, is, ‘Son, what I’ve learned in my life is when it don’t make sense, it’s God. Because some of this stuff is so stupid it don’t make sense. That means God is closing doors and opening doors to make sure you get to where you’re supposed to go.”

Sure, every draft comes with negativity and smear campaigns for some prospects. No, that doesn’t make it right. And Deion doesn’t buy it.

Some suggest the 23-year-old Shedeur – who passed for 4,134 yards with 37 TDs and led the nation with a 74% completion rate last season – won’t even be a first-round pick.

Now that’s laughable.

“This is venomous,” Deion contended. “It’s to the point where it ain’t even cute no more. It’s so predictable. I’m flipping the channel today, listening. ‘Jaxson Dart is special; Shedeur Sanders ain’t…’ Y’all c’mon. Stop.”

Daddy Prime is hardly the first father to fiercely defend his sons, which includes Shilo, the Colorado safety who is projected to go undrafted. He’s the rare father, though, with an overpowering presence built on his NFL excellence and an electric persona that remains decades since his heyday – a flair that, then and now, has drawn its share of detractors.

Deion thinks that’s a factor about now.

“It’s like just because they come from me, people take unsolicited shots at them. That’s not fair,” said Deion, who coached Shedeur and Heisman Trophy winner Travis Hunter at Jackson State for two seasons before they bolted to Colorado.

“Just say you don’t like me. Just say you’re tired of me winning, you’re tired of me being the light, tired of me being up, just consistently provoking change wherever I go. Just say that. But don’t attack my kids because of that.”

One case that ruffled Daddy Prime’s feathers come out of the NFL scouting combine in late February and early March: Veteran NFL reporter Josina Anderson reported that the quarterbacks coach from one team, with one of the top seven picks in the draft, maintained that Shedeur came off as “brash” and “arrogant” during his interview with the team.

“The brother who lied and said that, I know what team he’s from,” Sanders reflected. “So, I called the head coach. I said, ‘Dog, c’mon, man. This is what we’re doing?”

The coach told Deion that the characterization was off base.

“He said, ‘That never happened. I was in the meeting. I ran the interview. Shedeur never came off like that. That’s not true,” Deion said.

Deion said that in assuring the coach he wouldn’t blow the story up, he added, “But check your staff, man.”

It should also be noted that during his media session at the combine, Shedeur was quite the contrast to the brash and arrogant description. While he expressed confidence that he can be a difference-maker for a team on the NFL level, he was cordial, respectful, witty and classy, thoughtful as he responded to a barrage of questions for 15 minutes.

The scrutiny on Shedeur reminds his father of the debate – and knocks – surrounding another quarterback: Lamar Jackson.

“We see some bull junk every year, but Lamar was probably the most recent,” Deion said.

Jackson, ultimately chosen in 2018 as the final pick of the first round – and fifth quarterback selected – was cast by some as a player who needed to switch to receiver.

“That was ridiculous,” Deion recalled. “Just insulting. But God was in that to get him where he needed to go, the city of Baltimore. Ozzie (Newsome, Ravens then-GM) took a shot at him. And two MVPs later, damn near the highest-paid quarterback later, who won? He won. He got to a better team, to a better situation, by it being later on.”

Deion insists that although he’s met with team owners, GMs and coaches, he’s never tried to influence where Shedeur lands – even if trying to be on the right side of the 50-50 success-to-bust rate for first-round quarterbacks. No, this would not be an Eli Manning-type of power play.

To amplify that message, Deion appeared on ‘The Skip Bayless Show’ podcast earlier this month and declared that Shedeur would embrace being drafted by any NFL team.

Was it important to make that definitive statement?

“No. I didn’t care,” Deion said. “There are some teams that may be right. Some teams I didn’t believe in. Some of them have been drafting early on for the last decade. It don’t take a rocket scientist to figure out that they don’t know what they’re doing.

“So, you’ve got to meet with people and say, ‘This is my son.’ With a quarterback, it’s all about where he goes, with the offensive coordinator, quarterback coach, line, system, all of that. I think there are some really good quarterbacks that got lost in the shuffle because of where they went. I really do. So, I don’t want him to be another statistic, because I know how smart he is. You can’t just tell him anything. He’s going to ask questions about it and you’ve got to be able to answer because he’s been fathered by somebody that knows the game.”

Shedeur won’t be in Green Bay to bear hug NFL Commissioner Roger Goodell after the pick comes in. Daddy Prime, Shedeur’s ultimate hype man, is throwing an invitation-only bash at his home on the outskirts of Dallas with “a beautiful tent and stage,” he said.

“It’s going to be a tremendous moment,” he added of Shedeur’s selection.

When that exact moment hits, though, is one of the most intriguing storylines of the draft. The New York Giants, picking third overall, conducted a private workout with Shedeur on Colorado’s campus last week to add to the plot. The New Orleans Saints, picking ninth, might be a possibility. The Pittsburgh Steelers, who hosted Shedeur for a visit, have the 21st pick and a crying need for a long-term quarterback – even if they strike a deal with Aaron Rodgers. And who knows? Quarterbacks tend to spark the trade market.

All said, big mystery.

“This is the first time when we haven’t been in control,” Deion said. “Like ever since youth football – we chose the youth team, chose the high school, chose the college. We can’t choose this. So, now you’ve got to relinquish all your power and full autonomy. You’ve got to sit back and really trust God.

Then Deion pivoted to another point, mocking questions about arm strength.

“First, he couldn’t throw, but then Pro Day comes and I didn’t hear that no more,” Deion said. “It was like, ‘So, your arm started getting weaker when? You threw across your body 60 yards in the air for a touchdown to take us to overtime with a Hail Mary. So, when did your arm get weak?’

“That kind of stupid stuff. So, he gets it. He’s always been prepared for it because he’s always dealt with it. We even dealt with it in Jackson. He gets it…We get a tremendous amount of light and a tremendous amount of ignorance as well.”

What a different type of draft experience for Daddy Prime. It was 36 years ago when Deion, sporting a Jheri curl, was drafted fifth overall by the Atlanta Falcons. And yes, with a budding Major League Baseball career in the mix, he influenced that selection in a banner draft crop that also included Hall of Famers Troy Aikman, Barry Sanders and Derrick Thomas among the top five picks.

Now the suspense is wrapped with so much speculation.

“He’s not falling,” Deion declared. “We’ve already won. We came from an HBCU, man. Who else will be drafted from an HBCU this year? Or was drafted last year? Or the year before that? The year before that? Since Steve McNair (third overall, 1995)? We won, already. And when they talk about him, they’ve got to mention HBCU and Colorado.”

Over the years, Deion has occasionally playfully “ranked” his five children, which include his youngest daughter, Shelomi, a college basketball player who last year transferred from Colorado to Alabama A&M.

Often, his oldest son, Deion. Jr., 31, has “ranked” No. 1. Deion, Jr.’s “Well-Off Media” company has ignited much online traffic (and recruiting hooks) with his behind-the-scenes content for his father’s program.

Yet, as the draft approaches, there’s no disputing who’s No.1. Still.

“My oldest daughter is No. 1 because she gave me my first grandchild,” he said of Deiondra, who became a mother in 2024. “Then Junior.’

“The boys are last,” he added of Shedeur and Shilo. “I mean, all of this draft drama we’ve got to go through.”

Thus, a draft board from Granddaddy Prime that won’t change on Thursday night.

Follow Jarrett Bell on social media: @JarrettBell

This post appeared first on USA TODAY
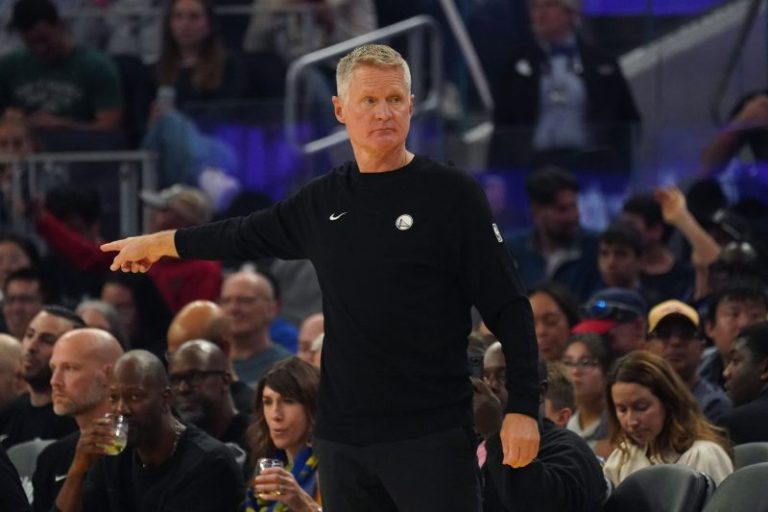
Steve McMichael, the Pro Football Hall of Famer and member of the Chicago Bears’ Super Bowl 20 team, has died. He was 67 years old.

‘The NFL is heartbroken to hear of the passing of Super Bowl champion and Hall of Famer Steve McMichael after a brave battle with ALS. Our thoughts and condolences are with his family and loved ones,’ the NFL said in a statement on X.

In 2021, McMichael was diagnosed with amyotrophic lateral sclerosis (ALS) and in August 2023 was confined to a bed, which is where he learned of his Hall of Fame selection, surrounded by friends and former teammates. He was officially inducted in August 2024. McMichael earned his spot in the Hall of Fame via the senior committee.

With that selection, McMichael became the sixth member of the famous 1985 Bears team to earn Pro Football Hall of Fame enshrinement, joining Jimbo Covert, Richard Dent, Dan Hampton, Walter Payton and Mike Singletary.

Payton’s son, Jarrett, announced McMichael’s death on X and said he was ‘grateful to have been with (McMichael) in his final moments.’

McMichael, a defensive tackle, was selected in the third round of the 1980 NFL draft by the New England Patriots out of the University of Texas. The Patriots released McMichael after just one season and he was picked up by the Bears, with whom McMichael excelled.

After two years as a reserve, he established himself as a star in 1983 in the Bears’ second season under coach Mike Ditka. McMichael controlled the interior of the line for the Bears’ famed ’46 defense’ that is considered to be one of the NFL’s best defensive units after leading Chicago to an 18-1 record and allowing only 10 points in three playoff wins, including a 46-10 demolition of the Patriots in Super Bowl 20.

In all, McMichael played 13 seasons in Chicago, earning two Pro Bowl selections and two first-team All-Pro nods. McMichael ranks second on the Bears’ all-time sack list behind Dent.

‘Steve McMichael told everyone he would fight ALS with the same tenacity he showed for 15 seasons in the National Football League. And he did just that,’ Pro Football Hall of Fame president and CEO Jim Porter said in a statement.

‘Everyone who played with or against Steve shares the same opinion: No one battled longer or harder from the snap until the whistle than Steve the player. That legendary will to fight allowed him to experience his enshrinement as a member of the Hall’s Class of 2024. And the love his teammates showed him throughout this difficult journey says everything about Steve the man.’

McMichael, nicknamed ‘Mongo,’ enjoyed a post-NFL career that included becoming a pro wrestling fixture.

This story has been updated with new information and video.

This post appeared first on USA TODAY

On Monday, the Dow dropped over 1,000 points after President Trump’s new round of criticism directed at Fed Chair Jerome Powell. The selloff reflects continued volatility driven by geopolitical tensions and uncertainty stemming from the ongoing trade war.

Meanwhile, the price of gold continued climbing to record highs, the U.S. dollar slipped to a three-year low, Bitcoin is working to recover the final 20% from its peak, and the broader market continued its downward slide.

This comparative snapshot on PerfCharts illustrates the bigger picture.

FIGURE 1. PERFCHARTS OF GOLD, DOLLAR INDEX, BITCOIN, AND THE S&P 500.  Safe haven is the name of the game.

When capital rotated out of stocks and Bitcoin, did it retreat to cash or gold? It’s a reasonable question, as cash appears to be circling the drain amid gold’s ascent.

Fear Trade Tailwinds

So, what’s going on, particularly with gold prices? Here’s a general snapshot:

  • The U.S. dollar index drop signals a loss of global confidence in the currency.
  • The possibility of Trump removing Powell raises fears about the Federal Reserve’s independence, especially as inflation concerns mount due to rising tariffs.
  • Fed Chair Powell indicated that rate hikes, not cuts, may be needed to control inflation.
  • Global trade tensions are intensifying, with China slashing U.S. oil imports and pivoting to other countries.
  • As the price of gold has broken through major resistance levels, SPDR Gold Shares (GLD) just crossed $100 billion in assets under management for the first time.

One More Thing: The Mar-a-Lago Accord

The so-called “Mar-a-Lago Accord” is an idea tied to Trump’s economic team that would pressure U.S. allies to accept a weaker dollar and lower returns on U.S. debt in exchange for military protection.

If it happens, the dollar would devalue further, making U.S. exports more competitive. Imports would become more expensive, though. A weaker dollar may continue to boost gold and Bitcoin, both viewed as safe havens. As for the S&P 500, some companies, especially exporters, might benefit, but concerns about inflation or trade conflicts could drag the market down even further.

Gold at $4,000 by 2026

While several analysts, such as those at UBS, have set a $3,500 price target for gold, the Goldman Sachs Group forecasts gold at $4,000 by 2026.

Let’s take a look at where gold is now. Take a look at this daily chart.

FIGURE 2. DAILY CHART OF GOLD. With gold at all-time highs, the pullback could bounce at one of these support levels.

While gold’s Relative Strength Index (RSI) reading is registering as “overbought,” you’ll have to wait and see if the current dip develops into a pullback. If it does, the key market highs and lows highlighted by the Price Channels (extended by the magenta dotted lines) are likely to serve as support. I also overlaid the Ichimoku Cloud to provide a wider projected support range into the near future.

If you’re bullish on gold and expecting to reach the $3,500 to $4,000 range as forecasted by analysts, you can use these support levels as favorable entry points. The $2,956 level is especially important; it marks a key swing low, and a close below it could call gold’s uptrend into question.

As for “Digital Gold” (Bitcoin)…

The other safe haven asset, as some would call it (emphasis on “some”), is Bitcoin ($BTCUSD). Let’s take a look at its current price action by zooming in on this daily chart.

FIGURE 3. DAILY CHART OF BITCOIN ($BTCUSD). It’s at a juncture point, currently testing resistance at $88,505.

Looking at the price channels, you can see how Bitcoin has been making consecutive lower lows over the last three months. It has also been making lower highs until March, where the high of $88,505 was tested three times, and that is where the digital asset is currently trading.

The Ichimoku Cloud range and the blue-shaded area highlight this resistance level. If the market decides on Bitcoin as a reliable safe haven, you will see its price break above this resistance level and challenge the next resistance level at $100K before challenging its all-time high at around $109K. Currently, its RSI reading is lifting above 50 and rising, indicating that the crypto has room to run before approaching any range that may be considered overbought.

What About the Dollar?

The weekly chart of the US Dollar Index ($USD) below highlights the key support level the dollar has just broken below.

FIGURE 4. WEEKLY CHART OF THE U.S. DOLLAR. Near-term support is near, but will it hold?

The US Dollar Index is at a three-year low, with support at $97 and $95. The RSI also indicates that the dollar is entering oversold levels. But these technical levels might not mean much considering the alleged intentional devaluation of the dollar. This trend appears to be guided more by political strategy than market fundamentals.

Meanwhile, the fear trade into safe-haven assets is likely to intensify until monetary policy and the current geopolitical chess moves generate a clearer sense of direction and stability.

At the Close

As far as gold’s rise, sentiment is doing the heavy lifting right now, but it’s rooted in legitimate fundamental risks. If those risks persist or worsen, fundamentals may eventually validate even higher price levels. Hence, the Goldman projection of $4,000 an ounce. If you’re looking to enter gold or Bitcoin, I’ve laid out the key support levels for gold and potential headwinds for Bitcoin.

Watch those price levels closely, and stay tuned to the latest geopolitical developments.


Disclaimer: This blog is for educational purposes only and should not be construed as financial advice. The ideas and strategies should never be used without first assessing your own personal and financial situation, or without consulting a financial professional.

Radisson Mining Resources Inc. (TSXV: RDS) (OTCQB: RMRDF) (FSE: 2RX) (‘Radisson’ or the ‘Company’) is pleased to announce that it intends to raise C$7 Million in a non-brokered private placement (the ‘Offering’), with the proceeds directed towards advancing the exploration and development of the Company’s O’Brien Gold Project located in the Abitibi region of Québec and for general corporate purposes.

The Offering will include the sale of the following securities (collectively, the ‘Securities‘):

  • Class A common shares of the Company (the ‘FT Shares‘) which shall each qualify as a ‘flow-through share’ as defined in subsection 66(15) of the Income Tax Act (Canada) (‘ITA‘) and section 359.1 of the Taxation Act (Québec) (the ‘Québec Tax Act‘), at a price of C$0.34 per FT Share; and,
  • Class A common shares of the Company (‘Common Shares‘) at a price of C$0.30 per Common Share.

The gross proceeds received by the Corporation from the sale of the FT Shares will be used to incur Canadian Exploration Expenses (‘CEE‘) that are ‘flow-through mining expenditures’ (as such terms are defined in the Income Tax Act (Canada)) on the O’Brien Gold Project in the Province of Québec, which will be renounced to the subscribers with an effective date no later than December 31, 2025, in the aggregate amount of not less than the total amount of the gross proceeds raised from the issue of FT Shares.

The closing of the Offering is expected to occur on or about May 15, 2025, and is subject to receipt of all necessary regulatory approvals including the acceptance of the Offering by the TSX Venture Exchange. All securities issued pursuant to the Offering will be subject to a four month hold period from the date of issue. A finder’s fee may apply to a portion of the proceeds raised under the Offering in the amount of 6% cash.

This news release does not constitute an offer to sell or a solicitation of an offer to buy the securities described herein in the United States. The securities described herein have not been and will not be registered under the United States Securities Act of 1933, as amended, and may not be offered or sold in the United States or to the account or benefit of a U.S. person absent an exemption from the registration requirements of such Act.

It is anticipated that one or more directors will acquire Securities under the Offering. Any such participation will be considered a ‘related party transaction’ as defined under Multilateral Instrument 61-101 (‘MI 61-101‘). It is anticipated that the transaction will be exempt from the formal valuation and minority shareholder approval requirements of MI 61-101 based on a determination that the securities of the Company are listed on the TSXV and that the fair market value of the Offering, insofar as it involves interested parties, will not exceed 25% of the market capitalization of the Company.

Radisson Mining Resources Inc.

Radisson is a gold exploration company focused on its 100% owned O’Brien Gold Project, located in the Bousquet-Cadillac mining camp along the world-renowned Larder-Lake-Cadillac Break in Abitibi, Québec. The Bousquet-Cadillac mining camp has produced over 25 million ounces of gold over the last 100 years. The Project hosts the former O’Brien Mine, considered to have been Québec’s highest-grade gold producer during its production. Indicated Mineral Resources are estimated at 0.50 million ounces (1.52 million tonnes at 10.26 g/t Au), with additional Inferred Mineral Resources estimated at 0.45 million ounces (1.60 million tonnes at 8.66 g/t Au). Please see the NI 43-101 ‘Technical Report on the O’Brien Project, Northwestern Québec, Canada’ effective March 2, 2023 and other filings made with Canadian securities regulatory authorities available at www.sedar.com for further details and assumptions relating to the O’Brien Gold Project.

For more information on Radisson, visit our website at www.radissonmining.com or contact:

Matt Manson
President and CEO
416.618.5885
mmanson@radissonmining.com

Kristina Pillon
Manager, Investor Relations
604.908.1695
kpillon@radissonmining.com

Forward-Looking Statements

This news release contains ‘forward-looking information’ within the meaning of the applicable Canadian securities legislation that is based on expectations, estimates, projections, and interpretations as at the date of this news release. Forward-looking statements including, but are not limited to, statements with respect to planned and ongoing drilling, the significance of drill results, the ability to continue drilling, the impact of drilling on the definition of any resource, the ability to incorporate new drilling in an updated technical report and resource modelling, the Company’s ability to grow the O’Brien project and the ability to convert inferred mineral resources to indicated mineral resources. Any statement that involves discussions with respect to predictions, expectations, interpretations, beliefs, plans, projections, objectives, assumptions, future events or performance (often but not always using phrases such as ‘expects’, or ‘does not expect’, ‘is expected’, ‘interpreted’, ‘management’s view’, ‘anticipates’ or ‘does not anticipate’, ‘plans’, ‘budget’, ‘scheduled’, ‘forecasts’, ‘estimates’, ‘believes’ or ‘intends’ or variations of such words and phrases or stating that certain actions, events or results ‘may’ or ‘could’, ‘would’, ‘might’ or ‘will’ be taken to occur or be achieved) are not statements of historical fact and may be forward-looking information and are intended to identify forward-looking information. Except for statements of historical fact relating to the Company, certain information contained herein constitutes forward-looking statements Forward-looking information is based on estimates of management of the Company, at the time it was made, involves known and unknown risks, uncertainties and other factors which may cause the actual results, performance or achievements of the companies to be materially different from any future results, performance or achievements expressed or implied by such forward-looking information. Such factors include, among others, risks relating to the drill results at O’Brien; the significance of drill results; the ability of drill results to accurately predict mineralization; the ability of any material to be mined in a matter that is economic. Although the forward-looking information contained in this news release is based upon what management believes, or believed at the time, to be reasonable assumptions, the parties cannot assure shareholders and prospective purchasers of securities that actual results will be consistent with such forward-looking information, as there may be other factors that cause results not to be as anticipated, estimated or intended, and neither the Company nor any other person assumes responsibility for the accuracy and completeness of any such forward-looking information. The Company believes that this forward-looking information is based on reasonable assumptions, but no assurance can be given that these expectations will prove to be correct and such forward-looking statements included in this press release should not be unduly relied upon. The Company does not undertake, and assumes no obligation, to update or revise any such forward-looking statements or forward-looking information contained herein to reflect new events or circumstances, except as may be required by law. These statements speak only as of the date of this news release.

Neither the TSX Venture Exchange nor its Regulation Services Provider (as that term is defined in the policies of the TSX Venture Exchange) accepts responsibility for the adequacy or accuracy of this news release. No stock exchange, securities commission or other regulatory authority has approved or disapproved the information contained herein.

Not for distribution to United States newswire services or for dissemination in the United States

To view the source version of this press release, please visit https://www.newsfilecorp.com/release/249318

News Provided by Newsfile via QuoteMedia

This post appeared first on investingnews.com