Author

admin

Browsing

Chick-fil-A is closing the last remaining restaurant of its kind as it continues to refine its strategy for rapid expansion.

The concept was designed to give customers something beyond the chain’s traditional menu, while allowing the company to test new products and a different way of serving guests.

However, after several years of experimentation, the company is preparing to bring the concept to an end.

The move comes as the restaurant chain continues to expand its footprint and experiment with new formats.

Chick-fil-A is closing its last Little Blue Menu

Chick-fil-A is closing its final Little Blue Menu location at 7242 Baltimore Ave in College Park, Maryland, in January 2027, ending the five-year experimental concept.

Little Blue Menu debuted as a test in Nashville in 2021 before Chick-fil-A expanded the concept to a standalone location in College Park in 2023. The concept allowed Chick-fil-A to serve its traditional menu alongside experimental offerings such as burgers, wings, pizza, and other items not typically available at standard restaurants.

The Nashville location closed in 2023, while the College Park restaurant continued operating as the concept’s last location. Chick-fil-A will now convert the College Park restaurant into a traditional Chick-fil-A location in January 2027, Streetcar Suburbs reported.

“Since its inception five years ago, Little Blue Menu was designed as a test-and-learn concept,” Chick-fil-A told Nation’s Restaurant News.

“After several successful years exploring new ways to serve guests, the location in College Park will transition to a traditional Chick-fil-A restaurant in 2027. We are grateful to remain part of the College Park community and look forward to sharing more soon.”

Chick-fil-A’s expansion strategy

Since its founding in 1946, Chick-fil-A has taken a more deliberate approach to expansion than many of its fast-food competitors.

The company remains family-owned and operates under a local owner-operator model, with individual restaurants managed by independent operators who oversee day-to-day operations in their communities.

The model gives individual responsibility for daily operations while allowing Chick-fil-A to maintain its broader approach to customer service and local engagement as it expands into new markets and formats.

The company continues to grow both domestically and internationally, opening its first restaurants in the UK and Singapore in 2025, following its entry into Puerto Rico in 2022.

The company’s expansion has also included a growing number of experiments aimed at reaching customers outside its traditional restaurant model.

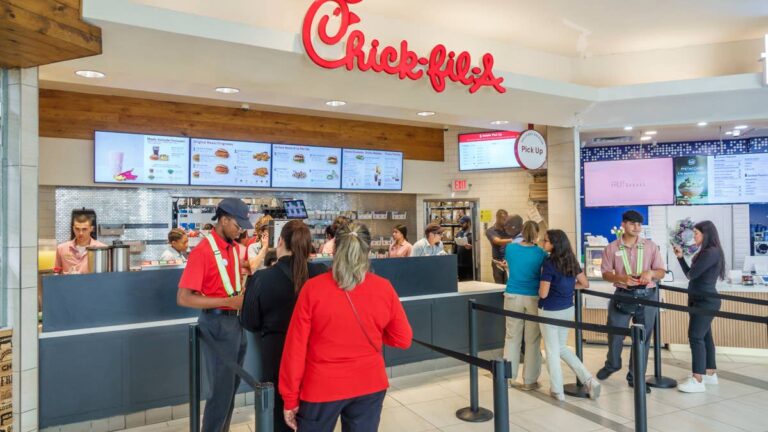
Chick-fil-A is closing its final Little Blue Menu restaurant concept.

Jeff Greenberg / Getty Images

Chick-fil-A’s experimental concepts

Chick-fil-A has continued to experiment with different restaurant formats and ways of reaching customers.

The company launched its first delivery and carryout locations in Nashville, Tennessee, and Louisville, Kentucky, in 2018, according to Nation’s Restaurant News. Those units were designed to support demand for catering, takeout, and delivery without relying on traditional dining rooms.

In 2019, Chick-fil-A expanded its delivery strategy by operating from a shared kitchen facility in Northern California in partnership with DoorDash.

Here’s some of my previous coverage on Chick-fil-A’s expansion strategy and experimental concepts:

  • In 2025, Chick-fil-A opened a ghost kitchen with CloudKitchens in Boston and expanded to Miami in 2026 as part of an ongoing effort to expand delivery capabilities.
  • In fall 2025, Chick-fil-A opened Daybright, a beverage-focused concept, in Hiram, Georgia, through its subsidiary, Red Wagon Ventures LLC.
  • At the same time, Chick-fil-A launched its first-ever vending machine, a temperature-controlled fridge that allows customers to access menu items through a touchscreen.
  • In late 2025, the company also began converting its licensed locations, including restaurants on college campuses, in hospitals, and at theme parks, excluding airports, to its owner-operator model. The change is designed to create a more consistent experience across its restaurants.

What this means for Chick-fil-A

Today, Chick-fil-A operates more than 3,000 restaurants across the U.S., Canada, Puerto Rico, the UK, and Singapore, according to its website.

While that footprint remains smaller than competitors such as McDonald’s, which operates more than 45,000 restaurants worldwide, and Subway, with over 35,000 locations, Chick-fil-A has become the third-largest quick-service restaurant company in the U.S. by system-wide sales.

Chick-fil-A generated more than $9 billion in company revenue in 2025, while its restaurants recorded nearly $24 billion in system-wide sales, according to data gathered by QSR Magazine.

The company’s continued growth means Little Blue Menu is only one part of a broader strategy that has seen Chick-fil-A test new restaurant formats, menu items, and service models while expanding its traditional locations.

The end of the Little Blue Menu experiment does not signal a retreat from innovation. Instead, it illustrates how Chick-fil-A has used experimental concepts to test new ideas and determine which formats may fit into its larger restaurant strategy.

Related: Chick-fil-A brings 9 former test items nationwide

The US stock market ended lower on Friday as investors assessed Federal Reserve Chair Kevin Warsh’s warning that recent inflation data had not shown enough improvement to alter the underlying trend.

The remarks increased expectations for a potential interest rate hike in September.

The S&P 500 fell 0.26% to 7,711.05, while the Nasdaq Composite dropped 0.53% to 26,400.56. The Dow Jones Industrial Average slipped 0.02% to 53,558.38.

Despite Friday’s declines, the Dow gained 0.5% for the week. The S&P 500 and Nasdaq fell 0.5% and 0.9%, respectively, over the same period.

Warsh comments lift rate hike expectations

Speaking at the Federal Reserve’s annual symposium in Jackson Hole, Wyoming, Warsh said recent PCE and CPI readings, while better than expected, did not indicate that underlying inflation trends had “meaningfully improved.”

He said the Federal Reserve needed to be confident that underlying inflation was moving toward its 2% target “clearly and at sufficient speed.” Otherwise, he said, the central bank still had work to do.

The comments prompted traders to increase their bets on a September rate hike.

According to CME Group’s FedWatch tool, the probability of a rate increase rose to around 57% on Friday from 35.4% a day earlier.

Treasury yields at the short end of the curve moved higher following the speech, while longer-term yields were roughly flat.

Mark Hackett, chief market strategist at Nationwide, said Warsh was reiterating the Fed’s hawkish stance rather than signaling an incremental change.

Bill Birmingham, managing director at REX Financial, similarly described the speech as a strong message about the Fed’s approach to inflation and monetary policy.

Chip stocks pull back

Technology stocks came under pressure, with semiconductor shares weighing on the Nasdaq. Nvidia declined, while Marvell Technology tumbled about 10% after its current-quarter non-GAAP gross margin guidance disappointed investors.

Marvell’s shares fell despite the company raising its 2027 revenue forecast. Investors remained concerned about the timing of revenue from its AI chip agreement with Alphabet.

The move followed a strong previous session for chip stocks, which had rallied after Nvidia issued a forecast signaling continued strength in AI-related demand.

Most megacap technology stocks were higher, however.

Alphabet gained, providing the biggest boost to the S&P 500’s communication services sector, while Apple also advanced. Salesforce extended its previous-session gains, supporting the Dow.

Gap jumps while Ulta and PayPal fall

Outside technology, Gap shares climbed after the retailer named industry veteran Michael Francis as the new chief executive of Old Navy and raised its annual profit forecast. The company’s shares gained despite a mixed quarterly report.

PayPal declined after Bloomberg News reported that a consortium involving Advent and Stripe had abandoned its pursuit of the payments company.

Ulta Beauty also fell after comparable sales growth slowed in the second quarter.

Investors additionally assessed consumer sentiment data. The final reading of the University of Michigan’s consumer sentiment survey came in at 51.7, slightly above economists’ estimate of 51.

With markets now closely split between a September rate hike and a hold, investors are likely to focus on upcoming inflation and employment data for further clues on the Federal Reserve’s next move.

The post Dow holds weekly gain as Warsh inflation warning lifts rate hike bets appeared first on Invezz

Markets await Federal Reserve Chair Warsh’s Jackson Hole speech, US Nonfarm Payrolls benchmark revisions, and sticky inflation data.

Federal Reserve Chair Kevin Warsh’s Jackson Hole Debut and Policy Uncertainty

Financial markets are intensely fixated on Federal Reserve Chair Kevin Warsh’s highly anticipated debut speech at the annual Jackson Hole Symposium. This address arrives at a critical juncture, perfectly coinciding with a stark and vocal policy divide among Federal Open Market Committee (FOMC) officials regarding how aggressively to handle persistent inflation, with figures like Cleveland Fed President Beth Hammack openly calling for action against an emerging “inflationary mindset”. While investors debate whether additional interest rate hikes are necessary to keep price pressures firmly anchored at the central bank’s two percent target, Warsh faces a delicate balancing act of trying to reduce market dependence on forward guidance without unnecessarily triggering a spike in short-term volatility or unsettling bond markets.

Preliminary US Nonfarm Payrolls Benchmark Revisions and Labor Market Realities

Market participants are closely tracking the Bureau of Labor Statistics’ release of the preliminary annual benchmark revision to the payroll employment series, a technical report that has gained massive institutional importance following the unexpectedly large revisions seen in recent years. Because historical adjustments have grown considerably in magnitude—such as the massive downward revision of 911K jobs recorded in previous cycles—any unexpected deviations in this dataset could drastically alter Wall Street’s perception of prior labor market strength. While analysts remain divided on whether the upcoming adjustment will skew positive or negative, a significant revision would profoundly influence broader monetary policy trajectories and change how the Federal Reserve interprets current employment momentum.

Sticky Core Inflation Pressures and Long-Term US Treasury Yield Volatility

Ongoing macroeconomic anxiety surrounding sticky core Personal Consumption Expenditures inflation, mounting cost-of-living concerns, and intense volatility in long-term US Treasury yields are keeping broader risk sentiment tightly constrained. Major currency pairs such as EUR/USD and USD/CAD continue to grind sideways in narrow trading bands as market participants wait on the sidelines for definitive policy signals from Jackson Hole and fresh economic catalysts to break the current consolidation phase. At the same time, geopolitical friction and energy supply dynamics—including ongoing stalemates affecting oil and natural gas flows—continue to inject persistent inflationary risks directly into the global economic outlook.

Top upcoming economic events:

  • 08/30/2026 23:50:00 – Retail Trade (YoY): This medium-impact indicator for the Japanese Yen measures annual changes in retail sector sales, providing key insights into consumer spending habits and broader domestic economic momentum.
  • 08/31/2026 01:30:00 – NBS Manufacturing PMI: This high-impact index tracks China’s factory health and industrial activity, serving as an essential gauge for the health of the world’s second-largest economy and its massive trade networks.
  • 08/31/2026 12:00:00 – Consumer Price Index (YoY): A major high-impact inflation release for the Eurozone, this metric calculates the year-over-year change in consumer prices, dictating future monetary policy decisions by the European Central Bank.
  • 09/01/2026 01:45:00 – RatingDog Manufacturing PMI: This high-impact survey captures conditions in China’s manufacturing sector, giving global investors vital early clues on regional industrial output and export demand.
  • 09/01/2026 06:00:00 – Retail Sales (YoY): This high-impact Eurozone metric measures annual shifts in retail turnover, reflecting consumer confidence and the overall strength of domestic demand across member nations.
  • 09/01/2026 09:00:00 – Core Harmonized Index of Consumer Prices (YoY): As a high-impact European inflation yardstick that strips out volatile items like food and energy, this figure is closely monitored by policymakers to gauge underlying price pressures.
  • 09/01/2026 09:00:00 – Unemployment Rate: This medium-impact Eurozone report measures the percentage of the total workforce that is actively seeking employment, highlighting labor market health and economic slack.
  • 09/01/2026 13:30:00 – S&P Global Manufacturing PMI: This medium-impact survey monitors the health of Canada’s manufacturing sector, offering actionable insights into industrial health, production output, and supply chain trends.
  • 09/01/2026 14:00:00 – ISM Manufacturing PMI: Serving as a premier high-impact indicator for the US economy, this index measures overall manufacturing activity, business confidence, and industrial demand to guide Federal Reserve expectations.
  • 09/01/2026 14:00:00 – JOLTS Job Openings: This medium-impact US report measures changes in job vacancies across the country, providing critical data on labor demand imbalances and overall employment market tightness.

 The subject matter and the content of this article are solely the views of the author. FinanceFeeds does not bear any legal responsibility for the content of this article and they do not reflect the viewpoint of FinanceFeeds or its editorial staff.

The information does not constitute advice or a recommendation on any course of action and does not take into account your personal circumstances, financial situation, or individual needs. We strongly recommend you seek independent professional advice or conduct your own independent research before acting upon any information contained in this article.

Aéropostale is partnering with a once-controversial brand to launch one of its latest collaboration collections as its partner works through a major transformation.

Not many brands have managed to navigate a business turnaround quite like Aéropostale.

From becoming a mall staple to filing for Chapter 11 bankruptcy in 2016 due to declining sales and falling foot traffic, closing more than 100 stores, and being delisted from the NYSE, the company has emerged from what might have seemed an irreversible decline.

Aéropostale has rebranded and worked to regain relevance among teens and young adults. Partnerships with other brands have become an important part of that strategy, and now the retailer is using its audience and retail presence to help bring another brand back into the spotlight.

Aéropostale releases new collaboration with Von Dutch

Aéropostale has teamed up with Von Dutch for the first time to launch a limited-time collection that aims to reintroduce the early-2000s brand to a new generation while giving its recognizable aesthetic a fresh take.

The collection features more than 30 pieces for men and women, including matching sets, sweats, hoodies, fleece, beanies, tanks, and graphic tees.

The pieces are priced between $20 and $45, offering a lower price point than comparable full-price apparel on Von Dutch’s retail website, where items currently range from $30 to $160.

The Aéropostale x Von Dutch collection will be available exclusively on the Aéropostale app from Aug. 27 to Aug. 28 before launching in stores and online on Sept. 2.

Why Von Dutch is partnering with Aéropostale

Von Dutch’s partnership with Aéropostale is intended to expand the brand’s awareness and relevance among younger consumers by leveraging Aéropostale’s established audience and physical retail presence.

Although Aéropostale does not publish quarterly earnings reports because it is a private company, ECDB estimated its 2025 annual revenue at $85 million, representing a 50% to 55% increase over the previous year.

ECDB also estimates Aéropostale could see revenue growth of 10% to 15% in 2026 compared to 2025.

Aéropostale partners with Von Dutch to launch a new collection.

David LEFRANC / Getty Images

The downfall of Von Dutch

Created in 1999, Von Dutch is named after the late artist Kenny “Von Dutch” Howard, whose trademark rights were acquired by the brand’s founders from his daughters. Howard himself had no involvement in the brand.

Von Dutch quickly became popular in the early 2000s for its punk-rock streetwear and trucker hats, along with its recognizable logo and bold patterns such as flames and pinstripes. The brand also became closely associated with pop culture after being worn by celebrities including Paris Hilton, Britney Spears, Gwen Stefani, and Justin Timberlake.

Here’s some of my previous coverage of brand revivals:

However, in the late 2000s, counterfeit products became a major issue for the brand. Von Dutch claimed that it was the second-most counterfeited label at the time.

In an effort to regain its exclusivity, Von Dutch began collaborating with companies outside of its traditional audience. The strategy did not restore the brand’s previous level of cultural relevance, and the label gradually lost some of the appeal that had made it a defining name in early-2000s fashion.

“I remember one day I looked in my closet and I had so much Von Dutch, and I just couldn’t look at it anymore. I got rid of everything,” Paris Hilton said in “The Curse of Von Dutch: A Brand to Die For,” which aired on Hulu.

Then, in May 2004, a letter Howard had written shortly before his death in 1992 was leaked to the press. The letter contained racist and antisemitic remarks.

Although Howard was only the namesake and had no involvement with the company, the controversy added to the challenges facing Von Dutch and further damaged the brand’s image.

Von Dutch began widespread store closures in the late 2000s. Its business eventually shifted toward a lighter-asset model, with the company shutting down its physical U.S. stores and making the brand available primarily online and through retail partners in the U.S. and international markets.

However, Von Dutch never filed for bankruptcy or ceased production entirely.

The revival of Von Dutch

Von Dutch was acquired by White Space Group (WSG) in 2024. The company acknowledged that the brand had largely faded from the U.S. market, with a significant decline in consumer engagement and retail presence.

However, WSG said it saw an opportunity to rebuild the brand.

According to a company announcement, its strategy includes restoring Von Dutch’s relevance, rebuilding its infrastructure, expanding its distribution, and introducing the brand to a new generation of consumers.

Since the acquisition, Von Dutch has been working to reposition the brand, expand its distribution channels, strengthen retail partnerships, and introduce new collections.

The company’s strategy has also placed a greater emphasis on collaborations that match, giving Von Dutch opportunities to reach consumers through established fashion and retail brands such as Aéropostale.

“In under two years, Von Dutch has grown into a nine-digit business, achieving global expansion across key wholesale, retail, and direct-to-consumer platforms,” said WSG.

“The brand’s resurgence has been fueled by strategic collaborations, enhanced marketing initiatives, and a renewed focus on quality, authenticity, and cultural relevance.”

Related: Sportswear giant closes 113 stores as shares plunge

Published 27 August 2026. Coinbase closed at $187.16 on 26 August 2026, down roughly 53% from its 52-week high of $402.16 and up 35% from its 52-week low of $139.11. Goldman Sachs raised its target to $196 on 25 August. The street runs from $148 (Barclays) to $330 (Bernstein). Verdict: the operating business is winning share while the reported numbers get worse – and the stock is priced for whichever of those two facts you believe matters.

Coinbase is the rare large-cap where the bull case and the bear case are built from the same earnings release. In Q2 2026 the company posted its highest-ever share of crypto trading volume and its third consecutive quarterly GAAP loss. Both are true. Neither is spin. The $148-to-$330 spread on Wall Street is not analysts disagreeing about the facts – it is analysts disagreeing about which set of facts the market will eventually pay for.

Key facts

  • COIN price: $187.16 at the 26 August 2026 close; intraday range $174.73-$189.27 – Investing.com
  • 52-week range: $139.11 to $402.16 – the stock sits 53.5% below the high and 34.5% above the low
  • Goldman Sachs target $196, raised from $173 on 25 August 2026 by analyst James Yaro, Buy rating maintained
  • Street low $148 (Barclays, Equal Weight); street high $330 (Bernstein, Outperform, cut from $440 in late March 2026)
  • Q2 2026 revenue $1.22bn, down 19% year on year, below consensus – Coinbase investor relations
  • Q2 net loss $359.5m; GAAP diluted EPS -$1.36 against consensus of +$0.15 – the third straight GAAP loss
  • Record 10.3% share of global crypto trading volume, a third consecutive quarter of record share
  • Subscription and services revenue $555.1m – a record 48% of net revenue of $1.15bn, against $599.2m of transaction revenue
  • Adjusted EBITDA $208m, the 14th consecutive positive quarter
  • Bitcoin traded near $78,800 on 27 August 2026 with total crypto market cap around $2.76trn

What actually happened in Q2, and why it reads two ways

Total revenue fell 19% year on year to $1.22bn. That is the number that made the headlines, and it is genuinely bad. But the reason is largely external: total crypto market capitalisation fell 11% quarter on quarter and spot trading volumes across the industry dropped 25%. Coinbase earns a spread on activity, and activity contracted.

Against a 25% industry volume decline, Coinbase took its share of global crypto trading volume to an all-time high of 10.3% – the third consecutive quarter of record share. That is the single most important operating fact in the release. A business losing revenue while gaining share is being hurt by its market, not by its competitors. A business losing revenue while losing share is being replaced. Coinbase is the first kind, and the distinction is worth roughly the entire gap between $148 and $330.

The $359.5m net loss needs unpacking too, because it is not an operating loss. Adjusted EBITDA was positive $208m, the 14th consecutive positive quarter. The GAAP loss came predominantly from marks on crypto assets held for investment, plus far smaller gains on equity investments than the year-ago period. When a company holds crypto on its balance sheet and crypto falls 11% in a quarter, the income statement records that – it does not mean the exchange stopped working. The counter-argument, which is fair, is that this cuts both ways and investors have been happy to count those marks as earnings when they ran the other direction.

The diversification is real, and it is the part the bulls are actually buying

Subscription and services revenue hit $555.1m, a record 48% of net revenue. That line – stablecoin income, staking, custody, Coinbase One – does not depend on people day-trading. It is the closest thing Coinbase has to recurring revenue, and it has been growing its share of the mix through a falling market, which is exactly when it matters.

The product cadence behind it has been unusually fast this month. FinanceFeeds reported that Coinbase debuted tokenized US stocks on Base for investors outside the US, and separately that Coinbase is using Chainlink to price four stock tokens while Aave lending waits for v4. Whether tokenized equities become a real revenue line or a footnote is unresolved, but it tells you where management is pointing: at products that earn fees regardless of crypto volatility.

Grading the $148 to $330 spread

Here is the street laid against the 26 August close of $187.16. Note that this is a genuine two-sided distribution: the low end sits meaningfully below the current price, which is not always the case on a widely-held large cap.

Case Target vs $187.16 spot Anchor What has to be true
Bear $148 -20.9% Barclays, Equal Weight Crypto volumes keep contracting, GAAP losses run to a fourth and fifth quarter, and record share stops being enough to offset a shrinking pie
Base $196 +4.7% Goldman Sachs, raised 25 Aug 2026 Bitcoin holds the $78,000-$80,000 area, volumes stabilise, and the 48% subscription mix keeps the floor under revenue
Consensus $196.55 to $215.11 +5.0% to +14.9% Investing.com avg / MarketBeat avg 22 of 25 covering analysts rate the stock a buy; the average target has drifted up with bitcoin
Bull $330 +76.3% Bernstein, Outperform A genuine crypto recovery restores volumes on top of record share, and stablecoin, derivatives and prediction-market lines scale into it

Two things are worth flagging about that table. First, Bernstein’s $330 is a cut from $440 made in late March 2026 – the street high has already come down a long way, so it is not a stale bubble-era number. Second, even Bernstein’s bull case leaves COIN 18% below its own 52-week high of $402.16. Nobody covering this stock is currently forecasting a return to where it traded a year ago.

The bear case, stated at its strongest

It is easy to wave away three consecutive GAAP losses as accounting noise. Do not. The pattern the bears point to is this: Coinbase’s revenue is a leveraged bet on crypto activity, that activity has now declined for multiple quarters, and the company’s answer – take more share of a smaller market – has a mathematical ceiling. Share cannot exceed 100%, and at 10.3% the incremental gains get harder against Binance and a widening field of brokerages adding crypto.

The balance-sheet exposure compounds it. Holding crypto as an investment means the reported bottom line swings with the asset class in both directions, which raises the cost of capital for anyone who has to underwrite the earnings stream. And bitcoin at roughly $78,800 is well off its highs; if it revisits lower levels, Q3 prints another mark-driven loss and the “it is just marks” defence gets harder to make for a fourth time. That path leads toward Barclays’ $148 without requiring anything dramatic – just more of what already happened.

Quick take

The setup: record market share and record revenue diversification, wrapped around a 19% revenue decline and a third straight GAAP loss. The market is paying $187.16 for that combination.

The number that matters most: 10.3% share. If it keeps climbing through a weak tape, the bear case is a cyclical story with an expiry date. If it stalls, the bear case is structural.

The asymmetry: $39 of downside to the street low against $143 of upside to the street high. That skew is why 22 of 25 analysts sit on buy – but the skew exists precisely because the downside scenario is considered more likely than the upside one, not less.

The catalyst calendar: Q3 results are the next hard test of whether the subscription mix can hold 48% while transaction revenue keeps sliding. Bitcoin’s behaviour around $78,000-$80,000 sets the tone in the meantime.

For a comparable read on a brokerage with crypto exposure priced on a different set of arguments, see FinanceFeeds’ Robinhood (HOOD) bull and bear case. The Goldman revision itself is covered in Goldman raises Coinbase target to $196 as Canaccord lifts Strategy to $175.

Frequently asked questions

What is the Coinbase (COIN) stock price prediction?

Wall Street targets run from $148 at the low (Barclays, Equal Weight) to $330 at the high (Bernstein, Outperform), against a 26 August 2026 close of $187.16. Goldman Sachs sits at $196 after raising from $173 on 25 August. Average targets cluster between $196.55 and $215.11 depending on the source, implying roughly 5% to 15% upside.

Why did Coinbase report a loss in Q2 2026?

The $359.5m net loss came mainly from marks on crypto assets Coinbase holds for investment, not from the exchange business. Adjusted EBITDA was positive $208m – the 14th consecutive positive quarter. GAAP diluted EPS was -$1.36 against consensus of +$0.15, the third straight GAAP loss.

Is Coinbase losing market share?

No – the opposite. Coinbase reached an all-time-high 10.3% share of global crypto trading volume in Q2 2026, its third consecutive quarter of record share. Revenue fell because the overall market shrank: total crypto market cap dropped 11% quarter on quarter and spot volumes fell 25%.

What is the bull case for COIN stock?

$330, or 76.3% above spot, per Bernstein. It requires a genuine recovery in crypto trading activity landing on top of record market share, with the subscription and services line – already a record 48% of net revenue at $555.1m – scaling through stablecoins, derivatives and newer products such as tokenized equities.

What is the bear case for COIN stock?

$148, or 20.9% below spot, per Barclays. It requires crypto volumes to keep contracting, GAAP losses to extend past three quarters, and share gains to stop compensating for a shrinking addressable market. Bitcoin weakness near $78,800 would keep balance-sheet marks working against reported earnings.

How far is COIN from its all-time high?

The stock closed at $187.16 on 26 August 2026, roughly 53.5% below its 52-week high of $402.16 and 34.5% above its 52-week low of $139.11. Notably, even the most bullish street target of $330 would leave it 18% below that 52-week high.

What should investors watch next?

Three things: whether subscription and services revenue holds its 48% share of the mix in Q3, whether the 10.3% trading-share figure keeps rising, and bitcoin’s behaviour around the $78,000-$80,000 area, which drives both transaction revenue and the balance-sheet marks that have produced three consecutive GAAP losses.

This article is for information only and does not constitute financial, investment or trading advice. FinanceFeeds does not recommend buying, selling or holding any security. Prices, analyst targets and company figures cited were verified on 27 August 2026 and change continuously. Do your own research and consider your own circumstances before acting.

Prices are something all American households still complain about.

However, that does not mean they aren’t going out to purchase clothes.

Abercrombie & Fitch (ANF) reported record second-quarter net sales of $1.27 billion, about 5% higher than a year ago and its 15th consecutive quarter of sales growth. It’s no small feat, considering the state of the average consumer these days.

Abercrombie-branded sales increased 8%, while Hollister sales rose 2%. All of this action helped the company lift its full-year sales outlook and projected earnings of $13.10 to $13.60 per share.

Understandably, such figures from the retail sector are a rarity these days. It’s why there was an outsized reaction to the results; the stock climbed nearly 30%. But there is an interesting caveat to the results.

Abercrombie received about $100 million in tariff refunds, according to Investopedia, adding roughly $1.75 per diluted share to quarterly earnings.

But the bigger story for shoppers is what happened without that refund: People kept buying.

Abercrombie is succeeding against a difficult consumer backdrop

The national retail outlook is not quite rosy. July U.S. retail and food-service sales were $763.6 billion, down 0.6% from June but 5% higher than a year ago, the Census Bureau said.

Consumers are also still feeling the effects of inflation. Overall prices were 3.4% higher in July than a year earlier, while apparel prices jumped 3.9%.

Clothing is a discretionary purchase, making Abercrombie’s performance all the more astounding. A household struggling with energy, groceries, and rent might easily delay buying another pair of pants.

Related: Abercrombie’s new NFL collection has vintage-inspired game day merch you’ll actually want to wear

Yet consumers continued to shop enough to help Abercrombie reach record sales in the Americas, where revenue climbed 5%. Asia-Pacific revenue increased by 19 percent, while EMEA revenue rose by 2 percent.

Behind the surge in sales, there is subtlety. Independent earnings coverage reported that overall comparable sales were flat and Hollister comparable sales were down.

That indicates some of the increase is coming from expansion, assortment, and other initiatives, rather than an explosion in traffic in existing stores across the board.

Tariff refund makes Abercrombie’s earnings headline tricky

Abercrombie posted diluted EPS of $4.17, compared with Wall Street expectations of around $1.98 to $1.99, The Motley Fool confirmed.

The $1.75 tariff-refund contribution accounts for much of that discrepancy, Investors.com also noted. But even after stripping it out, earnings still came in over forecasts.

More Retail:

That’s the difference investors need to see.

The return turned a good quarter into a great quarter, although it did not produce the whole underlying improvement.

Abercrombie expects about $120 million in total tariff-refund benefits for the full year, with roughly another $20 million expected in the current quarter.

Numbers investors should separate

  • Net sales: $1.27 billion
  • Sales growth: 5%
  • Abercrombie brand growth: 8%
  • Hollister growth: 2%
  • EPS: $4.17
  • Tariff-refund contribution: $1.75 per share
  • Q2 tariff refund: About $100 million pre-tax
  • Share repurchases: $177 million
  • Full-year sales outlook: Roughly 5% growth

The company is also aggressively returning cash to shareholders. It bought back $177 million of stock during Q2 and $282 million year to date, which is equivalent to about 7% of the shares outstanding at the beginning of the year.

Management increased the full-year repurchase target to at least $500 million.

Abercrombie’s huge earnings beat hides something investors should notice.

M. Suhail / Getty Images

Abercrombie’s comeback is stronger than the headline suggests

Abercrombie’s quarter is fascinating because the $100 million tariff refund can mask a business that is still growing underneath.

Sales for the second quarter were $1.27 billion, the 15th straight quarter of growth, the company said. The Abercrombie brand saw sales up 8%, while comparable sales for the brand increased 4%.

Hollister was softer, with sales up 2% but comparable sales down 3%.

This split tells us something useful about shoppers.

It’s not that Americans suddenly feel flush and Abercrombie is winning because of that. Apparel inflation was running still at 3.9% year on year in July, and broader retail spending has been patchy.

But shoppers are still opting to spend at Abercrombie when clothing is one of the simpler household items to delay.

The company is also growing at a quicker clip outside its primary U.S. market than many investors might think. Asia Pacific sales climbed 19 percent, the Americas surged 5%, and EMEA increased 2%.

And here’s the bit investors should not miss: Even with the $100 million tariff return adding around $1.75 per share to earnings, as Investopedia reported, Abercrombie still outperformed estimates after stripping much of that advantage away.

Wall Street had expected about $1.98 to $1.99 per share; the reported EPS was $4.17.

What Abercrombie is telling us about shoppers

Main Street’s takeaway is that American homes don’t suddenly have money to waste. Personal consumer spending rose just 0.2% in July, according to the Bureau of Economic Analysis, and spending on products actually dropped.

Consumers are nervous, but they are not only closing their wallets. They’re being choosy about which brands get their money.

Abercrombie has been able to remain on that list. Still, ANF investors’ job is to find a permanent consumer victory, not a temporary profitability bump.

Abercrombie needs teenagers, 20-somethings, and older shoppers to keep showing up. That’s the number that matters after the tariff refund check clears.

Related: Popular mall retailer continues comeback after closing stores

The cryptocurrency market experienced a dramatic shift in momentum in late August 2026, with digital assets surging to break a 5-year record. The total crypto market cap climbed roughly 24% in a single week, adding over $474 billion in value to reach a staggering $2.67 trillion. This marks the largest weekly gain the crypto market has seen since February 2021. With the sentiment shifting from prolonged fear to “extreme greed,” this CRYPTO MARKET OVERVIEW examines the fundamental drivers, institutional metrics, and technical indicators behind the ongoing price action.

U.S. Treasury Buybacks Trigger Crypto Market Response

The sudden reversal in market sentiment can be traced directly to macroeconomic policy shifts from Washington. On August 19, 2026, the U.S. Treasury announced it would double its maximum long-end debt buybacks for 10-to-30-year nominal coupon securities. Beginning September 9, this purchase cap will increase from $2 billion to at least $4 billion per operation. The announcement immediately weakened the U.S. dollar and lowered bond yields, nudging investors toward risk assets like cryptocurrencies and catching bearish traders entirely off guard.

This dynamic sparked a historic short squeeze. Short liquidations reached $2.74 billion on August 20 alone, wiping out 172,202 traders in a single session, and ultimately climbed above $4 billion over the ensuing breakout window. The speed of this sentiment shift has been equally historic. The Crypto Fear and Greed Index skyrocketed to 74 on August 25, a level last seen on October 5, 2025, while CoinMarketCap’s own index hit 81, placing the market firmly in the “extreme greed” category.

Source – Cryptocurrency Prices, Charts And Market Capitalizations | CoinMarketCap

These favorable liquidity conditions particularly benefit risk-on equities. Wall Street giant Goldman Sachs turned cautiously optimistic for the second half of 2026, lifting its price target on Coinbase (COIN) to $196 and maintaining a buy rating. Similarly, Canaccord Genuity raised its target for MicroStrategy (MSTR) by 35% to $175, declaring that the setup for the stock had “materially brightened”.

“Buy-rated COIN offers upside optionality from any persistent improvement in the crypto backdrop, and continues to see strong idiosyncratic growth in newer businesses (including derivatives and prediction markets).”

— Goldman Sachs Analysts

Technical Analysis Reveals Bitcoin Bullish Potential

Our CRYPTO MARKET OVERVIEW reveals that Bitcoin supplied much of the price momentum, climbing 24% to briefly cross $81,250 for the first time since May before pulling back to consolidate near $79,250. From a technical perspective, Bitcoin moved decisively above its 200-day simple moving average (SMA) of $69,166, signaling a major structural change from the summer doldrums. However, the rapid ascent pushed the daily relative strength index (RSI) to 82.44, placing it deeply into overbought territory.

Source- TradingView.com

Traders are now laser-focused on a massive $6.4 billion Bitcoin options expiry scheduled for Friday on Deribit. Shaun Fernando, Deribit’s Chief Risk Officer, explained the stakes: “Over half a billion in notional sits within a 5% move of the current price, which should result in increased gamma hedging in the build-up to expiry”. Market makers hedging their exposure could cause the spot price to pin near key strike levels, particularly the heavily favored $80,000 call option strike.

Liquidation heatmaps confirm that a stronger move below the $78,000 support level could draw prices toward additional liquidity around $77,200. Conversely, to resume the bullish breakout, Bitcoin needs to reclaim and hold the $79,200 to $80,000 area on a closing basis to target the May resistance region of $82,000 to $83,000.

Spot ETFs and Institutional Market Depth Fuel Optimism

The cryptocurrency surge coincides with major institutional developments for privacy coins and altcoins. On August 25, Grayscale officially launched the first U.S. exchange-traded product offering direct exposure to Zcash on NYSE Arca under the ticker ZCSH. Steve Vanourny, Grayscale Head of Index, provided insight into the token’s institutional appeal: “As AI reshapes how financial activity can be monitored, we believe demand for genuine financial privacy will only grow”.

Zcash rallied heavily on ETF anticipation, surging 60% to an eight-year high near $880 before traders started taking profits, cooling the token down to $787. Zcash’s network momentum was further secured by the recent Ironwood upgrade, which successfully patched a critical vulnerability in the Orchard shielded pool and introduced new accounting rules to prevent counterfeiting.

Spot Bitcoin ETFs absorbed a staggering $337.56 million on August 24 alone, while Ethereum funds pulled in $115.57 million. Solana ETFs also saw their largest daily inflows since late 2025, capturing $33.49 million. Despite the “extreme greed” sentiment, some analysts warn the rally lacks broad structural confirmation, as ETFs remain net sellers for 2026 with total holdings down by approximately 92,000 BTC year-to-date.

CRYPTO MARKET OVERVIEW FAQ

What triggered the recent $4 billion crypto short squeeze? The massive short squeeze was primarily catalyzed by the U.S. Treasury’s announcement on August 19, 2026, that it would double its long-end debt buybacks to at least $4 billion per operation starting in September. This decision weakened bond yields and the U.S. dollar, driving sudden institutional demand for risk assets like Bitcoin and catching bearish traders off guard, resulting in over $4 billion in liquidated short positions.

Are institutional investors continuing to buy Bitcoin and altcoins? Yes, institutional demand is visibly accelerating in the short term, though long-term metrics remain mixed. Spot Bitcoin and Ethereum ETFs collectively pulled in over $2.3 billion in a matter of days following the Treasury announcement, and newer products like Grayscale’s Zcash ETF (ZCSH) and Solana ETFs have logged multi-month highs for daily inflows. However, when looking at the year-to-date data, U.S. ETFs still remain net sellers for 2026.

Is the current Bitcoin rally expected to face a pullback? Yes, a short-term correction is highly possible. Technical indicators show Bitcoin’s daily RSI reaching 82.44, placing the asset deep inside overbought territory. Analysts have identified bearish divergences on lower timeframes and noted heavy liquidation clusters around the $78,000 support level. Furthermore, the impending $6.4 billion options expiry could inject significant volatility into the market by the end of the week.

What are your primary price targets and accumulation zones if Bitcoin retraces toward the $72,000 support level?